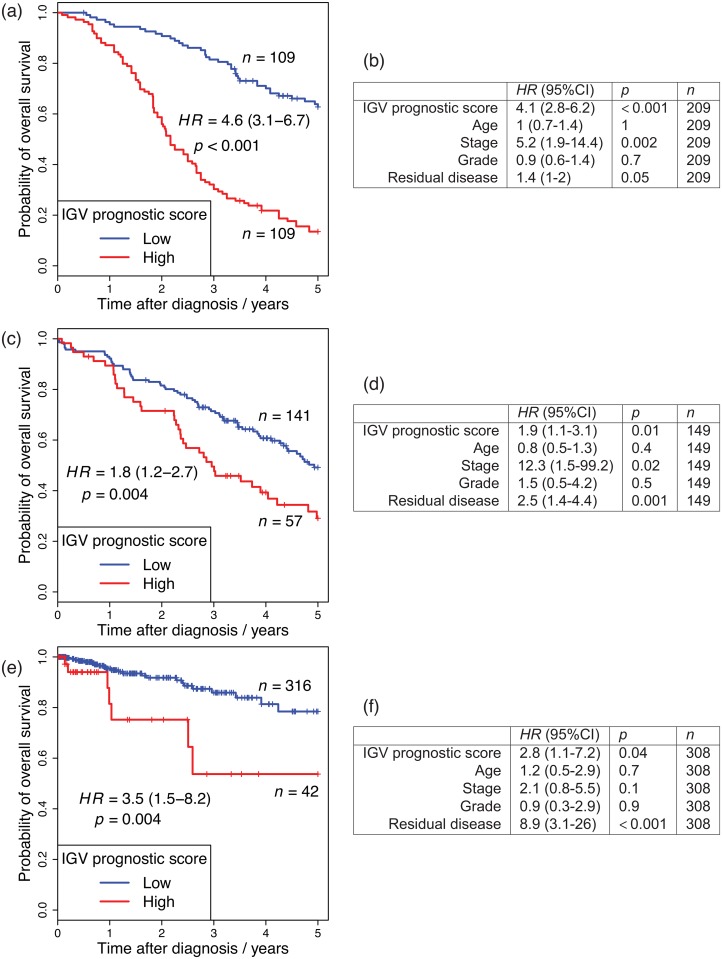
Fig 3. IGV OC prognostic signature validation.
(a), (c) and (e): Comparison of survival curves of groups defined by the IGV prognostic score, in: (a) the main OC data set, (c) the Mayo Clinic OC validation set, (e) the uterine cancer TCGA validation set. The groups are divided by the median IGV prognostic score derived in the main OC DNAm data-set. The hazard ratio (HR) is displayed with 95% C.I. in brackets, with corresponding p-value calculated by univariate Cox regression. (d), (e) and (f): Multivariate Cox regression comparing the same groups defined by the IGV prognostic score.

