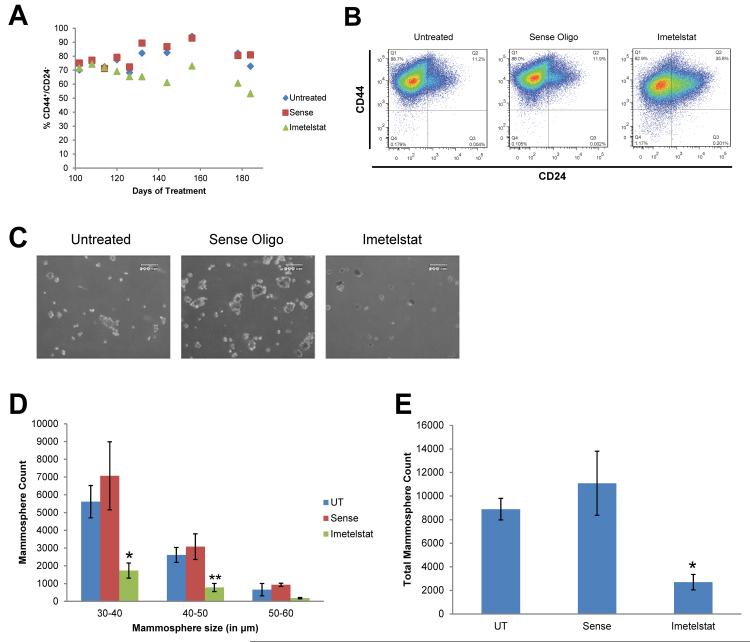
Fig. 2.
Imetelstat but not the sense oligonucleotide control decreases the CSC population and mammosphere counts. A) Scatter plot of CSC marker expression following treatment. B) Flow cytometry analysis of CSC marker expression. C) Representative images of mammosphere cultures following pretreatment. D) Primary mammosphere count grouped by mammosphere size (n=3), average ± SD, one-way ANOVA, * p<0.05, ** p< 0.01 compared to untreated. E) Sum of mammosphere size groups as total mammosphere count, average ± SD, ANOVA, * p< 0.05 compared to untreated.

