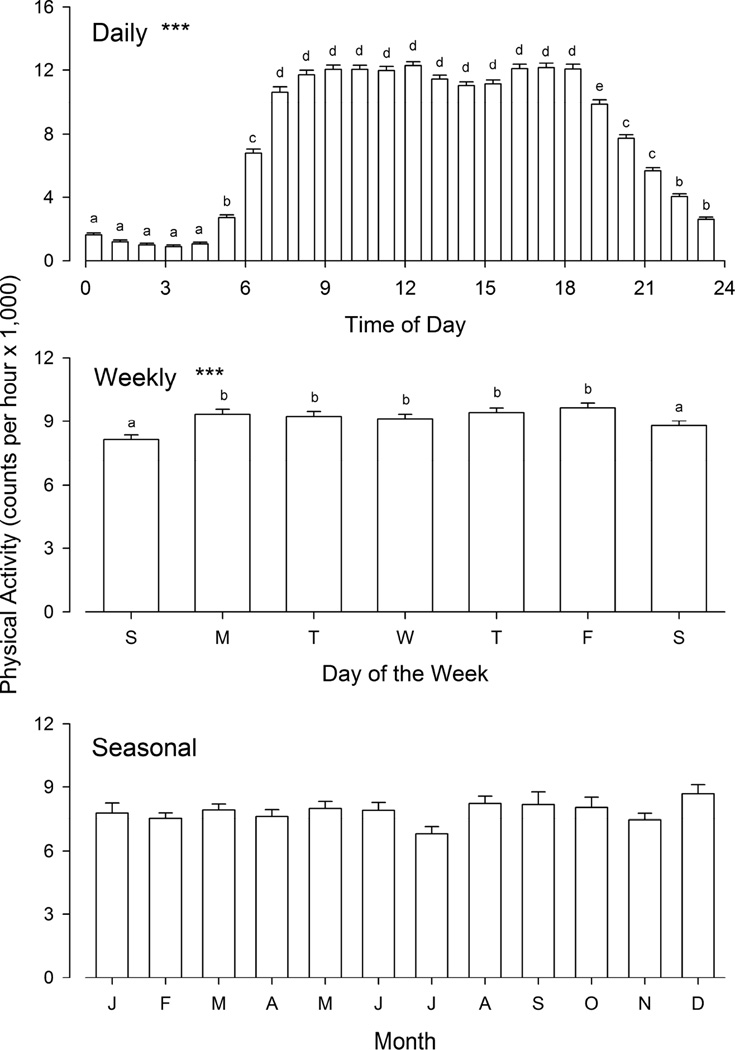
Fig. 2.
Results of the secondary analysis for the combined data set of men and women from the five countries. The bars represent mean values (± SEM) of physical activity (in counts per hour × 1,000). Asterisks indicate probabilities (corrected for multiple testing) associated with the F statistics obtained in one-way ANOVAs for each panel: *** p < 0.0001. Absence of asterisks indicates p > 0.10. When the main effect is significant, significance of multiple comparisons by Tukey’s test is indicated by lower case letters: bars with different letters are significantly different from each other.

