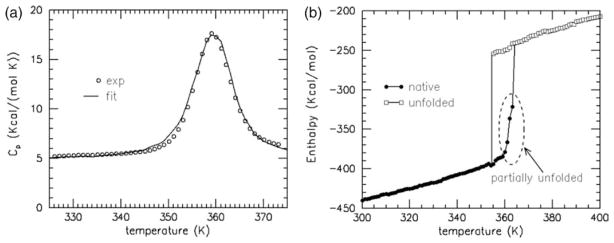
Figure 1.
(a) DCM parameterization is achieved by fitting to heat capacity curves. The best-fit (line) and experimental curves (circles) at pH 7.0 are shown. The experimental curves are taken from Georgescu et al.5 (b) The enthalpy for the native and unfolded states is shown. Hysteresis indicates that the transition has two-state character. The region outlined by the broken ellipse for the unfolding process is not sharp, suggesting the protein partly unfolds before it completely unfolds.

