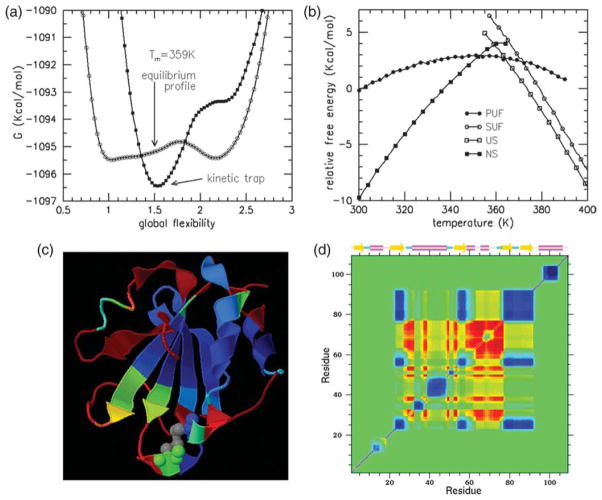
Figure 10.
(a) Under the appropriate conditional ensemble of conformations for the folding core, its flexibility free energy is compared with that of intact Trx in equilibrium at T=359 K. The partially unfolded form (PUF) has lowest free energy. (b) The relative free energies of the native state (NS), unfolded state (US), PUF representing the kinetic trap, and its denatured super unfolded form (SUF) are plotted as a function of temperature. If the actual free energies were plotted, the results would be obscure. Therefore, all data points for all four free energies were plotted and a best linear straight line fit was made. From linear regression, the free energy reference line Gref=(−2.128T–335.431) kcal/mol was used to define the zero in this plot. Note that T is measured in Kelvin. (c) A color ribbon cartoon for PR is shown, where red denotes high probability (flexible) and blue is low probability (rigid). Comparison to Figure 5(c) highlights how the PUF is much more flexible compared to the native state. (d) The cooperativity correlation plot within the folding core at T=359 K is similar to that of intact Trx at T=359 K, as shown in Figure 8(b). However, there are no correlations (green) in far off-diagonal terms outside the core region. The flexibly correlated regions that couple to the active site are identical, albeit with higher degree of flexibility.

