Figure 2.
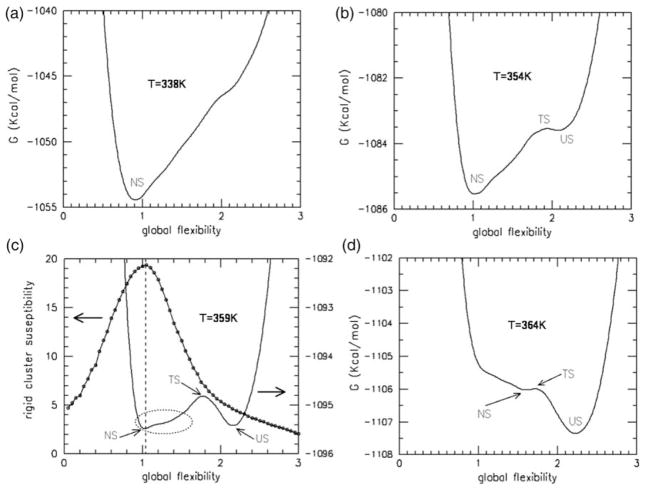
Flexibility free energy landscapes as a function of global flexibility at temperatures 338 K, 354 K, 359 K and 364 K indicate a first-order (two-state) phase transition. The labels NS, TS and US denote the native, transition and unfolded states, respectively. (a) Only one free energy basin occurs at T=338 K. (b) A metastable unfolded state is present at 5 °C below Tm. (c) The free energy has two stable basins at Tm (359 K), where native and unfolded ensembles are populated. The mechanical transition is also characterized by the rigid cluster susceptibility. The vertical broken line shows how near the minimum in the native free energy basin is to the maximum in the rigid cluster susceptibility. The broken ellipse highlights the skewness within the bottom of the native-state basin showing that the native basin contains many flexible conformations. (d) The native metastable state is nearly vanished at 5 °C above Tm.

