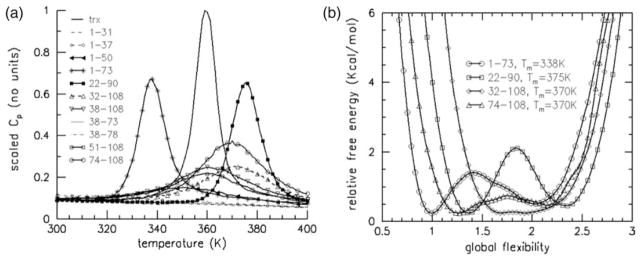
Figure 3.
(a) Scaled Cp predictions (Cp,max×108)/(Cp,max,Trx×Nres) for intact Trx, and ten fragments using the same DCM parameters based upon the best-fit to Cp of intact Trx. The large reduction in the scaled Cp curves for each of the fragments indicates that they are generally disordered. (b) Four fragments are selected to illustrate the diversity found in flexibility free energy curves that describe thermodynamic properties and the characteristic of their structural transitions (if any).

