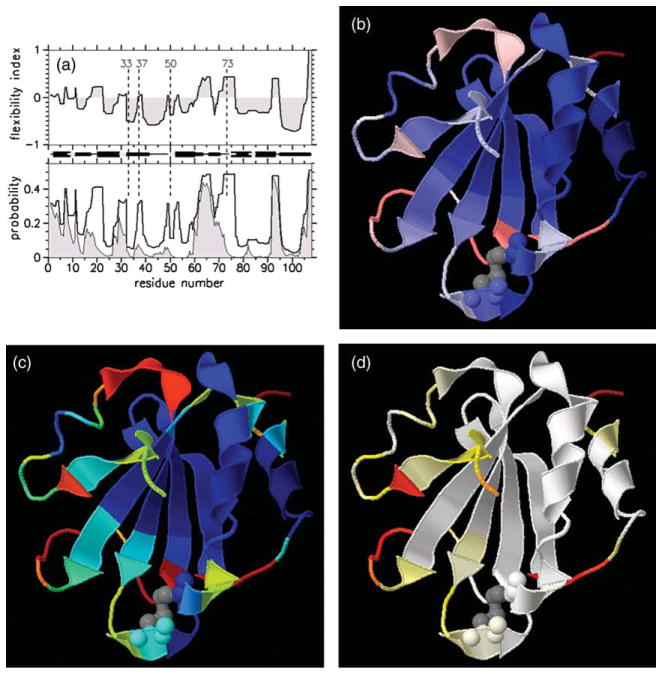
Figure 5.
Native state backbone flexibility profiles for T=338 K. (a) Three backbone measures for flexibility are plotted against residue number, where flexibility index, Findex, is in the top panel, the probability to rotate, PR, and probability to be an independent dof, Pidf, are both shown in the lower panel. Shading is used for Pidf. Between the two panels is a schematic representation of the secondary structure along the sequence. Residues 33, 37, 50 and 73 are highlighted using vertical broken lines to guide the eye between the three graphics. These three quantities are rendered onto a 3D cartoon representation. Gray coloring for the disulfide bond between residues 32–35 highlights the active site region. (b) Findex is colored red when flexible, blue when rigid, and white near marginally rigid. (c) PR is colored red when very flexible, yellow when flexible, green when marginally rigid, cyan when rigid, and dark blue when very rigid. PR highlights the regions that maintain being flexible, or rigid consistently. (d) Pidf is colored white when it equals zero, and (yellow, red) for when there are (low, high) density of independent dof.

