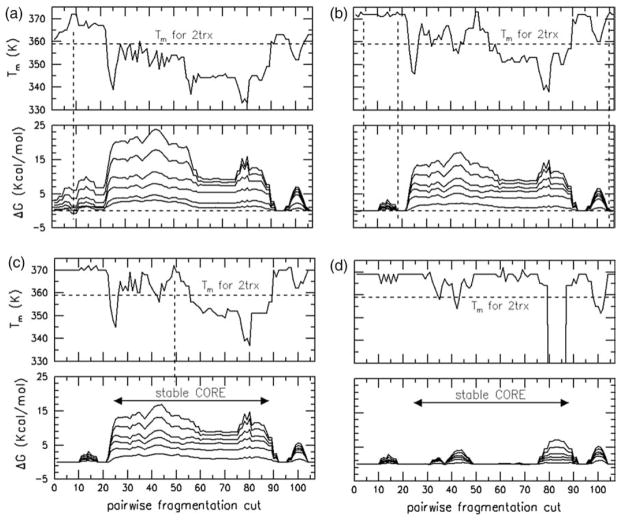
Figure 6.
In all four panels, two graphs (bottom and top) are shown. ΔG of track-cuts with respect to a previously perturbed structure is plotted against cut-locations in the bottom graph. These data depend on temperature, but the curves lack labels for clarity. Although there are some line crossings, generally, the greatest ΔG occur at 300 K, and each line moving downward tends to flatten out, corresponding in turn to 320 K, 340 K, 360 K, 380 K, and 400 K. The top graph shows the melting temperature. All four panels (a)–(d) have the same scale for the abscissa and ordinate. Therefore, axis labels are only provided on the graphs in the left-most and bottom-most panels. Each panel shows the result of a series of fragmentations that is explained in the text.

