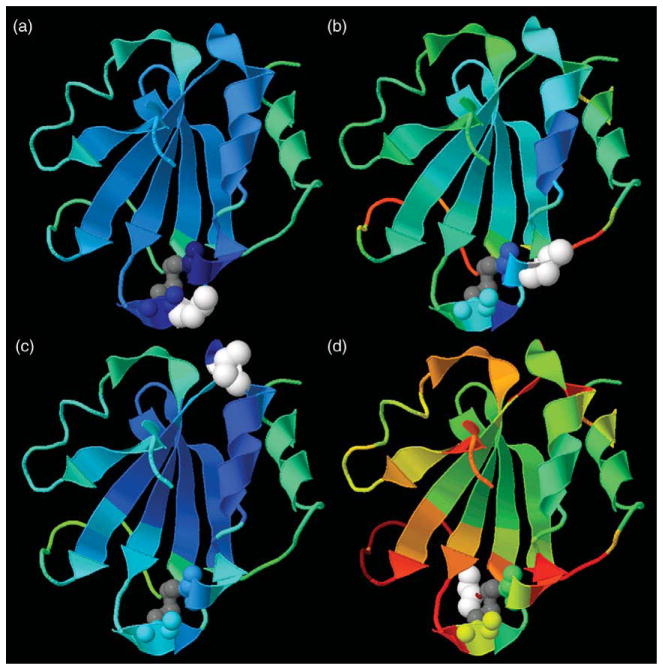
Figure 9.
The cooperativity correlation plot for T=338 K in Figure 8(a) is mapped onto the 3D Trx structure using residues 33, 37, 50 and 73 as four different reference points. The coloring used for the rendering retains the same meaning as defined in Figure 8. The gray coloring for the disulfide bond between residues 32–35 highlights the active site region. The reference residue is colored white, because it can be flexibly and rigidly correlated to different regions within the protein simultaneously. Renderings for reference residues, 33, 37, 50 and 73 are shown in (a), (b), (c) and (d), respectively.

