
Figure 1. Comparison of liquid densities between experiment and simulation.
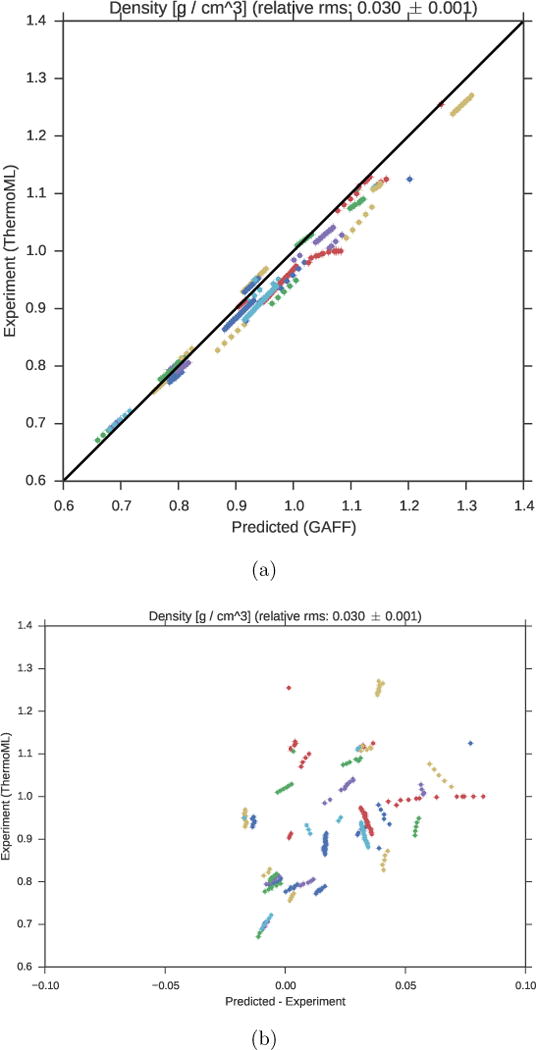
(a). Liquid density measurements extracted from ThermoML are compared against densities predicted using the GAFF/AM1-BCC small molecule fixed-charge forcefield. Color groupings represent identical chemical species, although the color map repeats itself due to the large (45) number of unique compounds. Plots of density versus temperature grouped by chemical species are available in Fig. S4. Simulation error bars represent one standard error of the mean, with the number of effective (uncorrelated) samples estimated using pymbar. Experimental error bars indicate the standard deviation between independently reported measurements, when available, or author-reported standard deviations in ThermoML entries; for some measurements, neither uncertainty 14 estimate is available. See Fig. S2 for further discussion of error. (b). The same plot, but with the residual (predicted minus experiment) on the x axis. Note that the error bars are all smaller than the symbols.