
Figure 2. Measured (ThermoML) versus predicted (GAFF/AM1-BCC) inverse static dielectrics.
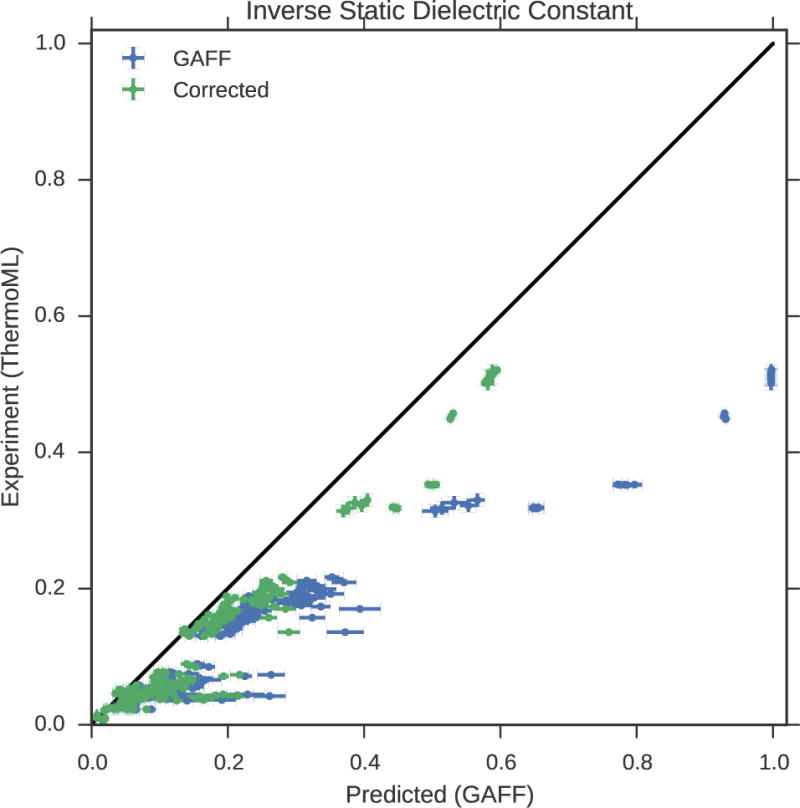
(a). Simulation error bars represent one standard error of the mean. Experimental error bars indicate the larger of standard deviation between independently reported measurements and the authors reported standard deviations; for some measurements, neither uncertainty estimate is available. See Fig. S3 for further discussion of error. See Section 3.2.2 for explanation of why inverse dielectric constant (rather than dielectric constant) is plotted. For nonpolar liquids, it is clear that the forcefield predicts electrostatic interactions that are substantially biased by missing polarizability. Plots of dielectric constant versus temperature grouped by chemical species are available in Fig. S5.