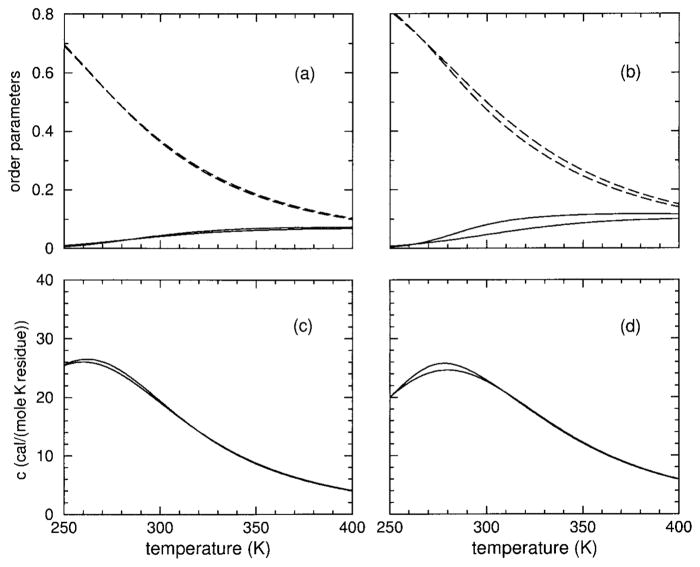
FIGURE 10.
Panel (a) shows (hydration, helix) content as (dashed, solid) lines for model I applied to the sCT(8–32) polypeptide at 4% HFIP concentration. Panel (c) shows the corresponding heat capacity. Similarly, panels (b) and (d) show results for model II. Two curves are shown for each quantity plotted. In all cases, the (bottom, top) curve corresponds to a chain length of (5, 10,000).

