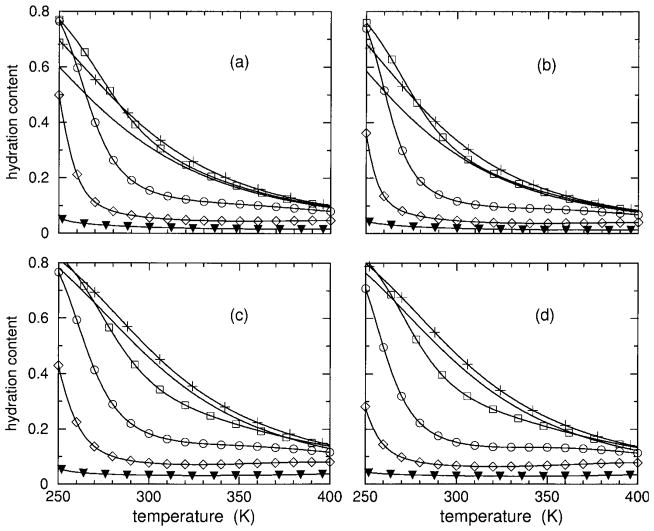
FIGURE 4.
Using parameters linearly interpolated from Table II, hydration content over an extended temperature range is shown for 0, 4, 8, 10, 12, and 15% HFIP concentrations. In panels (a) and (c), results are shown for polypeptide sCT(8 –32) with an effective chain length of 16, using models I and II, respectively. In panels (b) and (d) results are shown for polypeptide YGG-3V with an effective chain length of 18, using models I and II, respectively. Because hydration content curves cross, the symbols plus, square, circle, diamond, and filled down triangle) are added to identify the 4, 8, 12, and 15% HFIP concentrations. The solid line without any symbol corresponds to 0% HFIP concentration.

