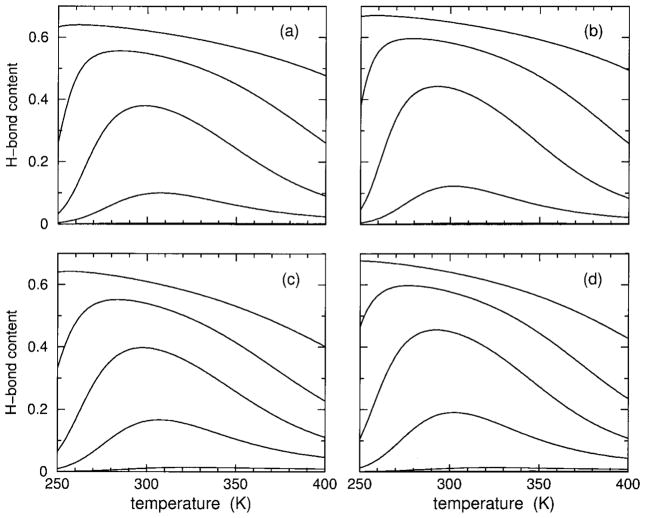
FIGURE 5.
Using parameters linearly interpolated from Table II, H-bond content over an extended temperature range is shown for 15, 12, 10, 8, 4, and 0% HFIP concentrations, which correspond to the solid line curves ordered from top to bottom in each panel. In panels (a) and (c), results are shown for polypeptide sCT(8 –32) with effective chain length of 16, using models I and II respectively. Panels (b) and (d) show results for polypeptide YGG-3V with an effective chain length of 18, using models I and II, respectively. In all cases, no H-bond content is found at 0% HFIP concentration, and only a tiny amount is predicted by model II at 4% HFIP concentration.

