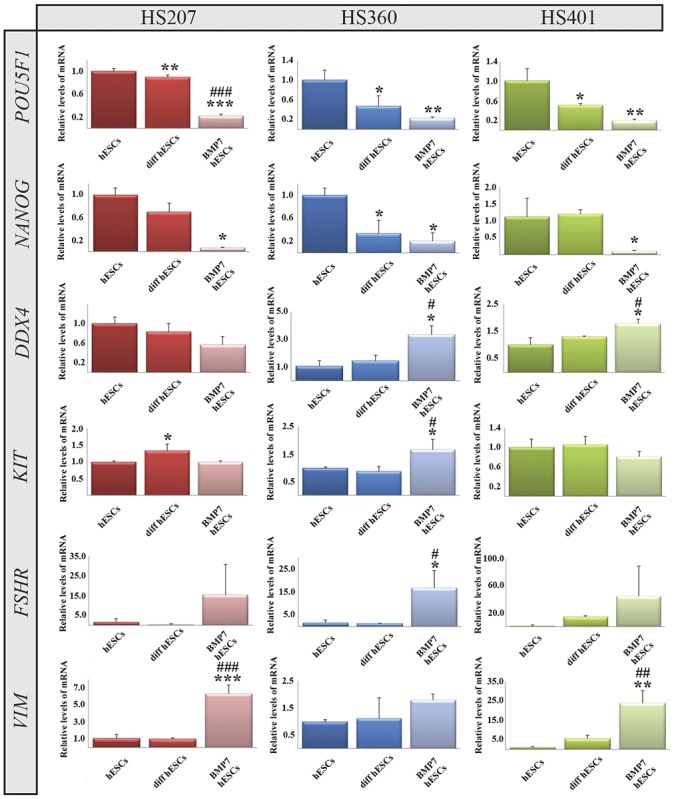
Fig 3. Expression of mRNA encoding the pluripotency markers NANOG and POU5F1, the germ cell marker DDX4 and Sertoli cell markers FSHR and VIM by HS207, HS360 and HS401 cells cultured and differentiated in suspension.

The relative level of mRNA was calculated by the ddCt procedure from the mean of triplicates and statistical analysis performed by way of One-way RM ANOVA. The error bars depict standard deviations. *p <0.05, **p <0.01, ***p <0.001 when comparing undifferentiated with differentiated cells. #p <0.05, ##p <0.01, ###p <0.001 when comparing BMP7-stimulated with unstimulated cells. For an explanation of the abbreviations, see the legend to Fig 2.
