
Fig 5. Astex Diverse Set re-docking.
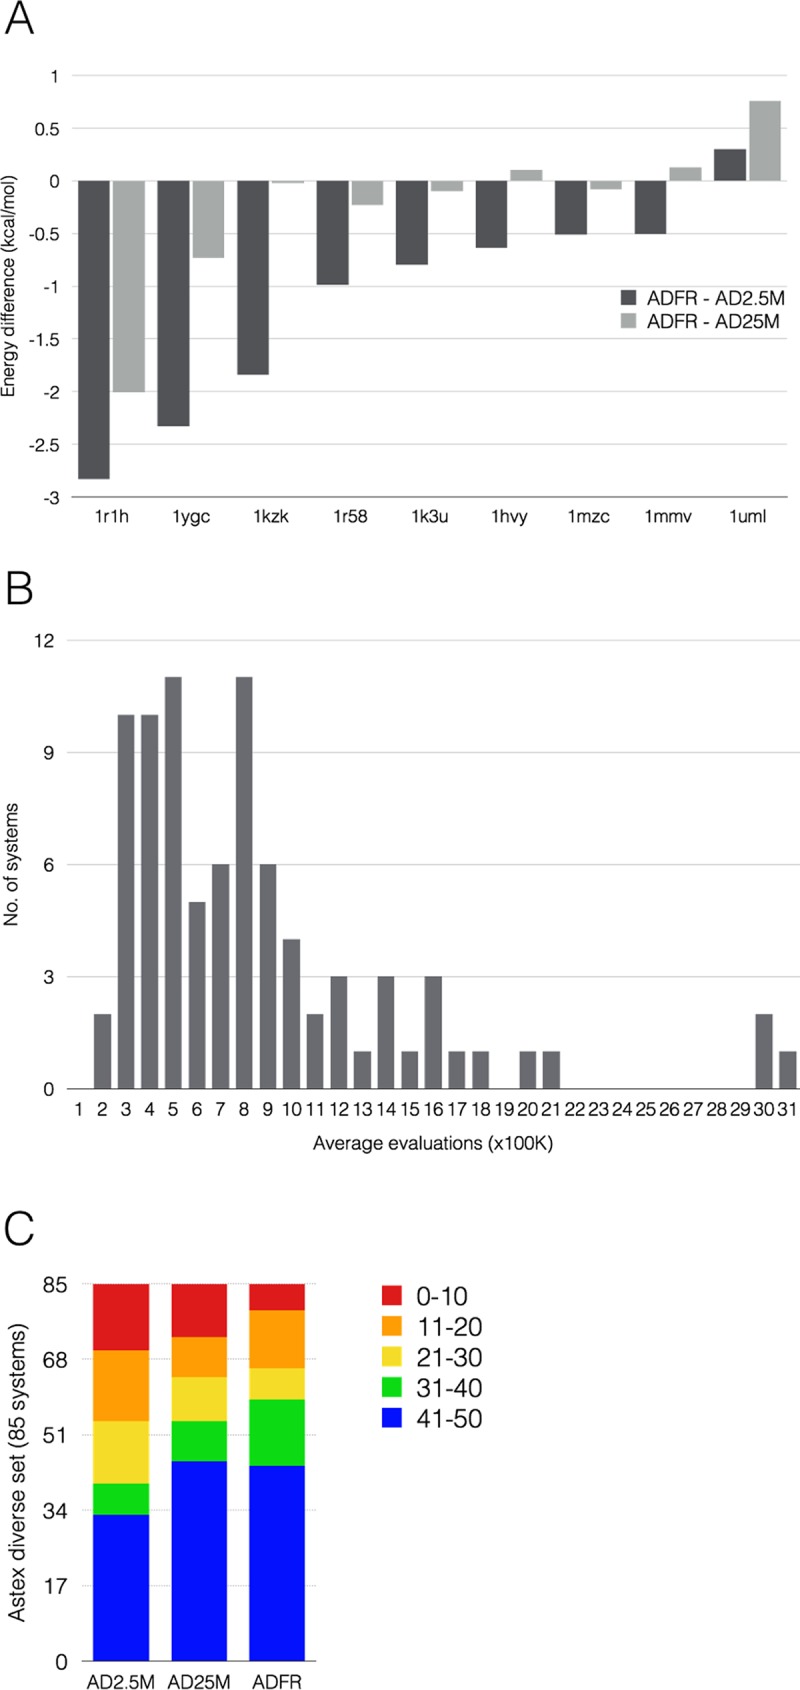
A) The bars depict the energy differences between lowest energy solution found by ADFR and AD2.5M (dark), and ADFR and AD25M (light). Negative values indicate a lower energy for the ADFR solution. Only complexes with at least one of the two differences larger than 0.5 kcal/mol are shown. 1R1H is the only complex where ADFR finds a significantly better solution than AutoDock (i.e. difference > 2 kcal/mol). B) This histogram shows the distribution of number of evaluations of the scoring function performed by ADFR in the GA evolution leading to lowest energy solution. C) Each docking consists of 50 GA evolutions, each producing a solution. The 50 solutions are clustered with an RMSD cutoff of 2Å. In this diagram the 85 complexes are binned based on the cluster size of the lowest energy solution indicating how many of the 50 GA runs identified the pose corresponding to the lowest energy pose found across the 50 runs, i.e. the reliability of the GA.