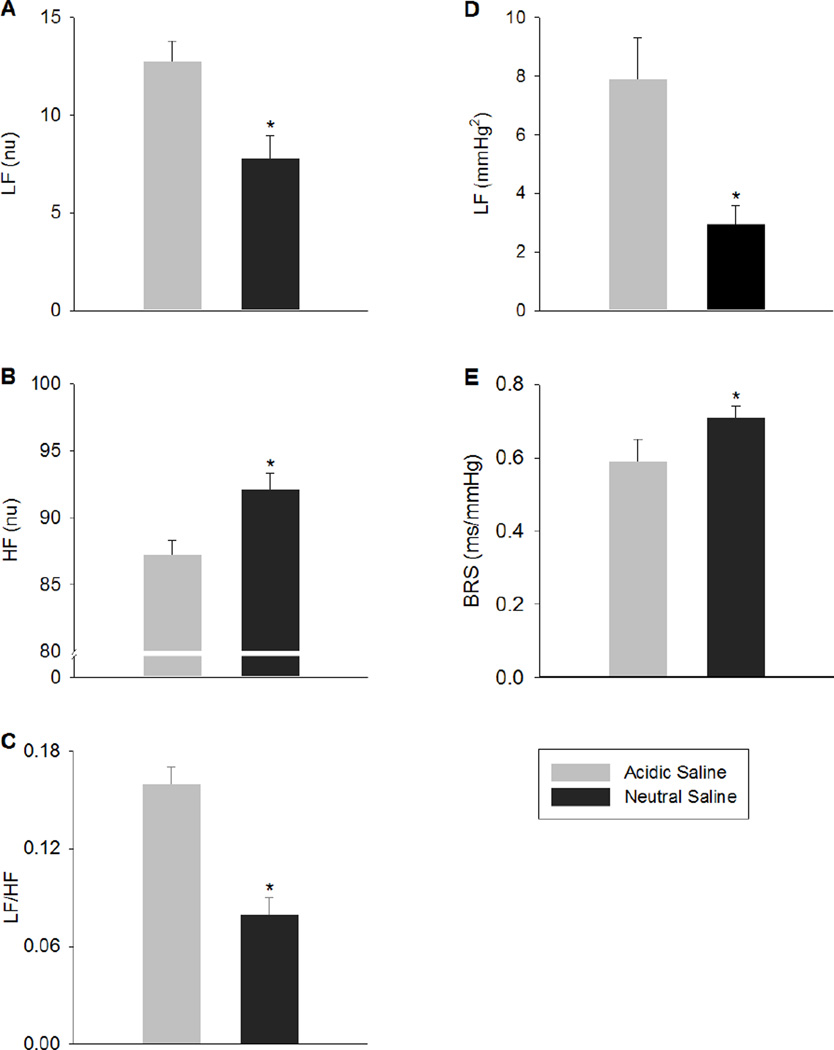
Fig. 1.
Power of PI spectra at low frequency band (LF; panel A), high frequency band (HF; panel B) and LF/HF ratio (panel C), power of SAP spectra at LF (panel D) and baroreflex sensitivity (BRS; panel E) of rats injected with acidic saline and neutral saline into the gastrocnemius muscle. * p< 0.05 compared to acidic saline.

