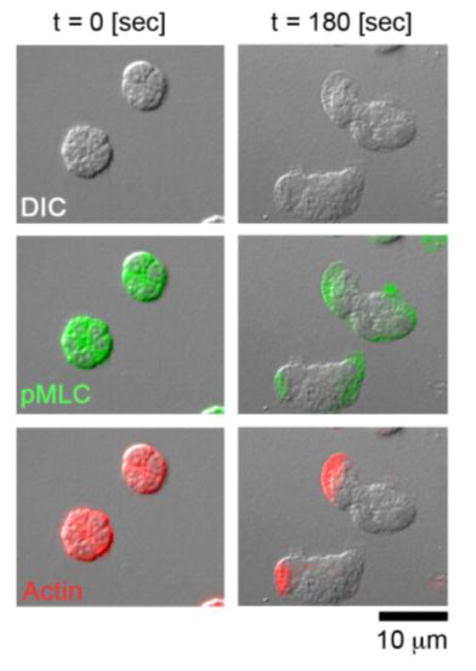
FIGURE 1. Cytoskeletal dynamics underlying neutrophil migration.
DIC imagery (first row), phospho-myosin light chain II (pMLC) staining (second row; shown in green), and actin staining (third row; shown in red) of neutrophils prior to fMLP stimulation (left) and 180 sec after fMLP stimulation (right).

