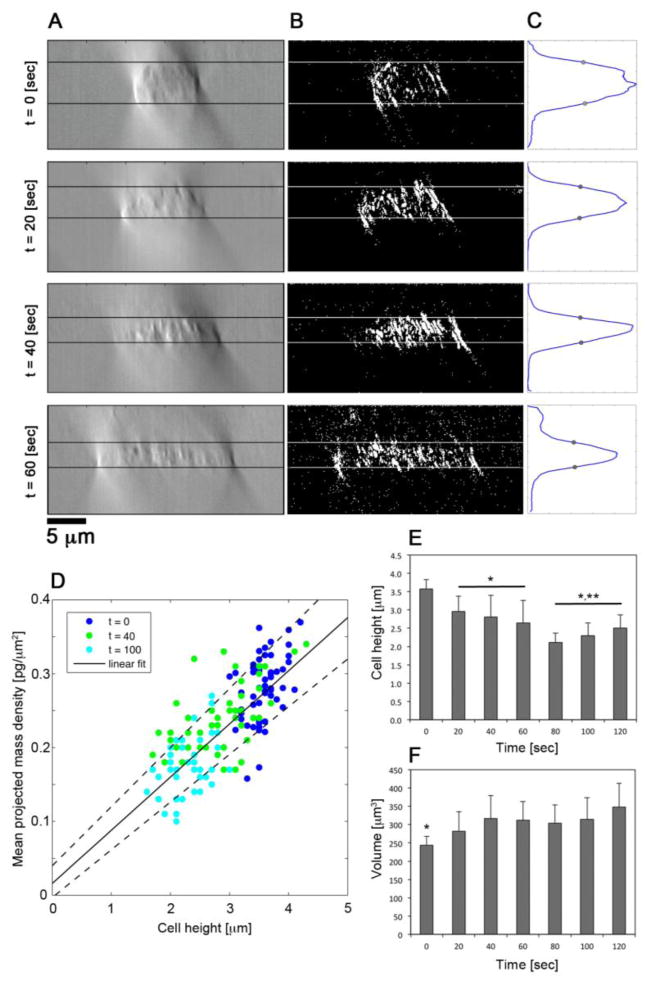
FIGURE 4. Three-dimensional analyses of neutrophil geometry.
(A) Representative cross-sectional DIC images with a Kohler illumination of NA = 0.9 of neutrophils fixed at 0, 20, 40, and 60 seconds after fMLP stimulation. (B) Binary image segmentation of cross sectional images in (A). (C) Transverse sum of binary images in (B) yielding a Gaussian-like distribution along the optical axis. The full width at half max (FWHM) is denoted by gray circles and lines in (A) and (B) correspond to the axial positions of the FWHM. (D) Scatter plot of mean projected density versus mean height of neutrophils fixed at 0 (blue), 40 (green), and 100 (cyan) seconds after fMLP stimulation. Linear fit line denotes . (E) Quantification of mean neutrophil height at 20 second intervals after fMLP stimulation. * denotes p-value < 0.05 compared to t = 0. ** denotes p-value < 0.05 compared to 20 ≤ t ≤ 60 seconds. (F) Approximate neutrophil volume at 20 second intervals after fMLP stimulation determined from the product of mean neutrophil height and area. * denotes p-value < 0.05 in comparison to time points ≥ 20 seconds.

