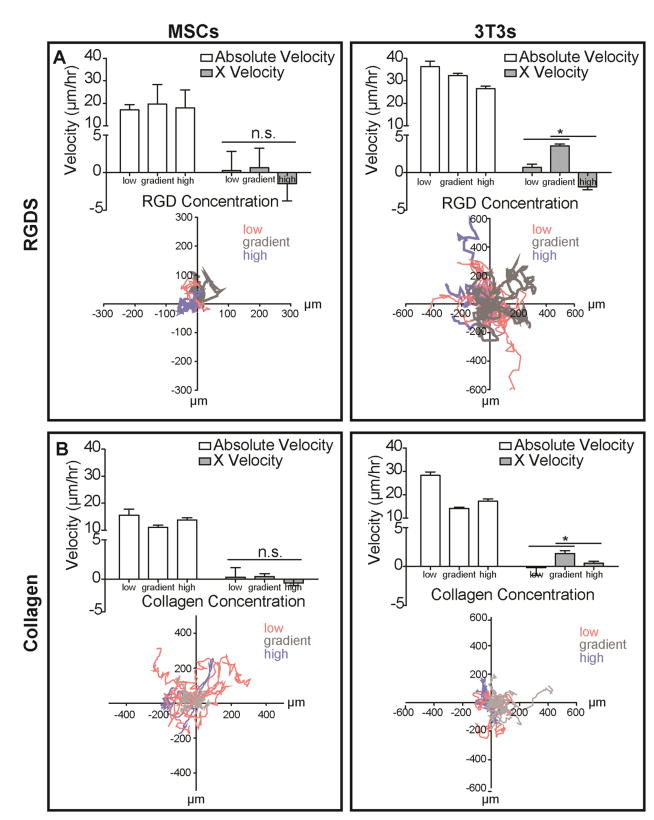
Fig. 2. Migratory Response of Stem Cells and Fibroblasts on Adhesive Ligand Gradients.
Absolute velocities and X velocities of MSCs (left) and 3T3s (right) on indicated regions of hydrogels with A. RGD concentration gradients and B. surface collagen density gradients. Low and high indicates cells found on the low and high static concentration regions of the substrate; gradient indicates cells found at the mixing interface of the substrate. Positive X velocity indicates migration towards regions of increasing adhesive ligand density. Representative rose plots show migratory paths of cells beginning at the origin. (n > 20; mean ± S.E.M.; *p < 0.05; n.s., not significant).

