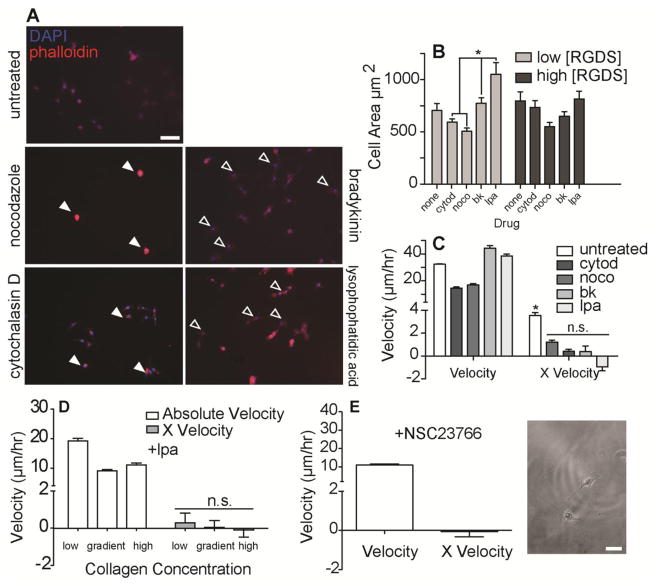
Fig. 3. Influence of Drug Treatment on Fibroblast Morphology and Migration.
A. 3T3 fibroblasts spread on PA-PEG-RGD hydrogels 24 hours after seeding and treating by the indicated drugs (actin, red; nuclei staining, blue). Filled white arrows indicate cells that are smaller and less spread than untreated control cells. Open white arrows indicate cells that are larger and more spread than untreated control cells. (scale bar, 100 μm). B. Spread area and C. absolute migratory velocities and X velocities of cells treated with the indicated drugs on low, gradient, and high regions of RGD gradient hydrogel substrates. (n > 20; mean ± S.E.M.; *p < 0.05; n.s., not significant). D. Absolute velocities and X velocities of 3T3s treated with LPA on indicated regions of acrylic acid hydrogels activated with surface gradients of collagen type I. (n > 20; mean ± S.E.M; n.s., not significant). E. Absolute velocities and X velocities of 3T3s treated with NSC23766 Rac inhibitor on gradient regions of acrylic acid hydrogels activated with surface gradients of collagen type I. Positive X velocity indicates migration towards regions of increasing adhesive ligand density. (n > 20; mean ± S.E.M.; scale bar, 100 μm).

