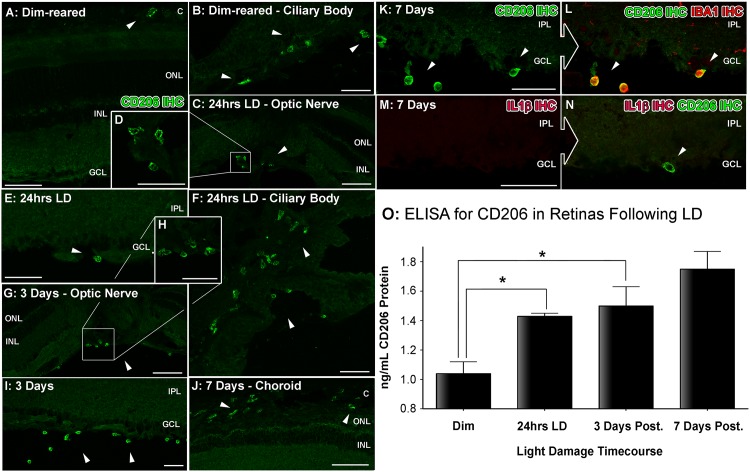
Fig 5. Spatiotemporal analysis of retinal CD206 protein levels following LD.
A-L: investigation of CD206 immunoreactivity (IR, green) in retinal cryosections over the course of LD. A-B: In dim-reared animals, immunoreactivity (IR) for Il-1β protein was occasionally observed within nuclei (arrowheads) amongst the choroid (A) and ciliary body (B). C-E: Following 24hrs LD, CD206+ nuclei appeared from the ciliary body (C-D, arrowheads) and among the superficial retinal vasculature (E, arrowhead) F: At 24hrs LD, CD206+ cells were also more abundant within the ciliary body (arrowheads). G-I: There was increased abundance of CD206+ nuclei among optic nerve head (G-H) and superficial retinal vasculature (I) after 3 days post-exposure (arrowheads), compared to 24hrs LD. J: CD206+ cells were occasionally found accumulating within the choroid at 7 days post-exposure (arrowheads). K-L: All IR for CD206 was found to correlate with circular IBA1+ cells (red). M-N: CD206-expressing cells (N, arrowhead) did not show any detectable IR for the M1 marker Il-1β (red). O: Quantification of CD206 protein levels in retinas via ELISA. At 3 and 7 days post-exposure, the levels of CD206 protein were significantly higher compared to dim-reared controls (P<0.05). Progressive increases were observed during the post-exposure period, though this was not significant between 3 and 7 days (P>0.05). C, choroid; GCL, ganglion cell layer; INL, inner nuclear layer; IPL, inner plexiform layer; IHC, immunohistochemistry; ONL, outer nuclear layer; OS, outer segments; RPE, retinal pigment epithelium. The trend in ELISA protein levels was significant by ANOVA (P < 0.05); N = 3 for each timepoint.

