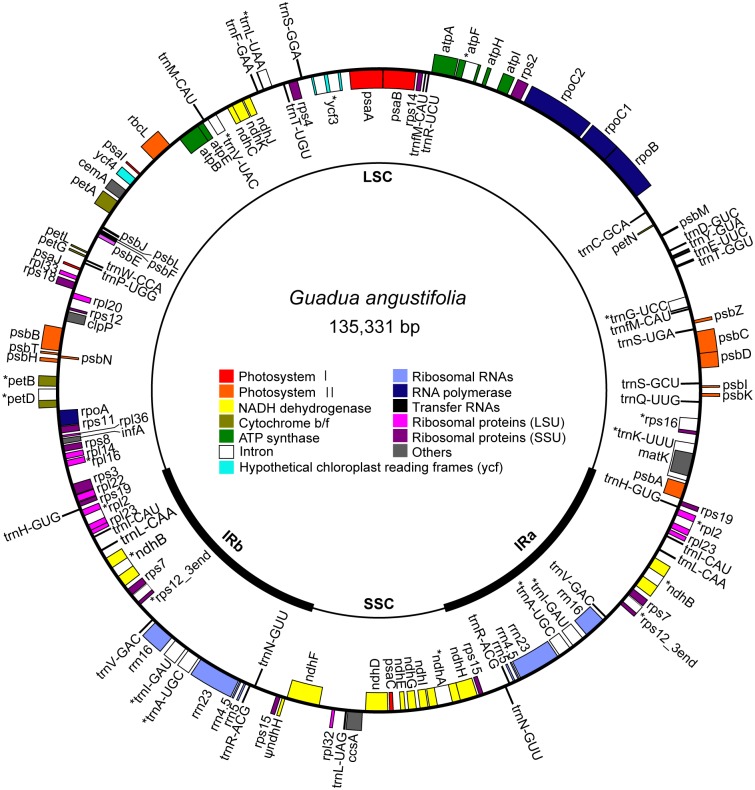
Fig 1. Gene map of the Guadua angustifolia chloroplast genome.
Inner thick arcs represent the inverted repeat regions (IRa and IRb). Genes inside and outside of the circle are transcribed clockwise and counterclockwise, respectively. Genes are colored according to their functional groups. *: genes with intron(s). Ψ: pseudogenes.

