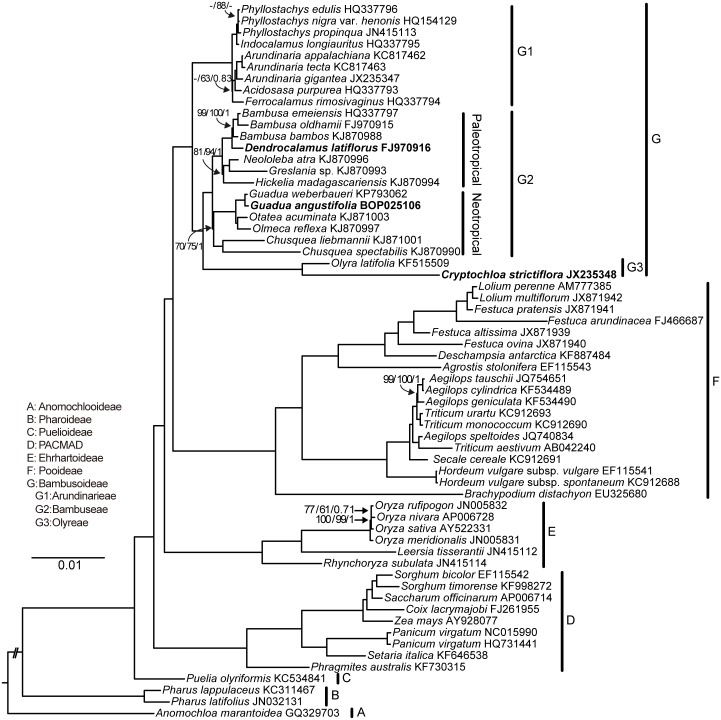
Fig 5. Maximum likelihood (ML) tree for 62 taxa based on completely aligned chloroplast genomes.
IRb and large gaps were excluded from the analysis. All nodes have 100% bootstrap percentages (BS) and 1.0 Bayesian posterior probabilities (PP), except where noted. Support values are shown as MP bootstrap/ ML bootstrap/ Bayesian posterior probability. “-” indicates nodes that are not supported in the analysis. The three tropical chloroplast genomes examined in this study are indicated in bold.

