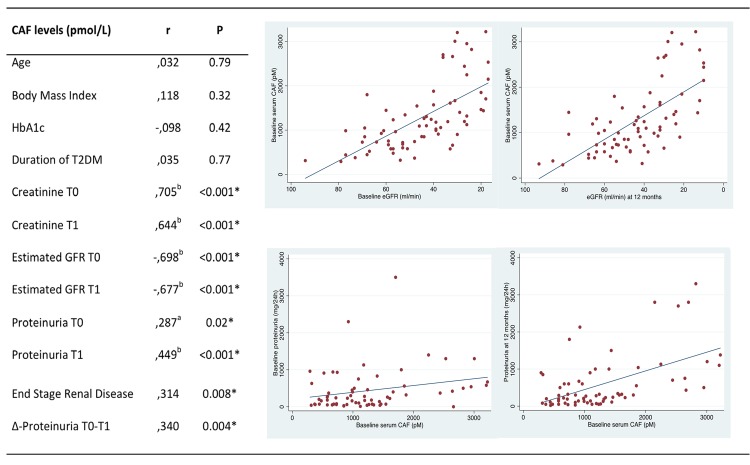
Fig 1. Correlation analysis of CAF levels with variables of laboratory and clinical significance and scatterplots of CAF with GFR and proteinuria.
Values represent Spearman’s correlation coefficients. a Correlation is significant at the 0.05 level (2-tailed). HbA1c, glycosylated hemoglobin A1c; T0, Time point 0 (Baseline); T1, Time point 2 (12 months); Δ-Proteinuria T0-T1, Increase of proteinuria (≥500mg/day) during the first year of follow-up.

