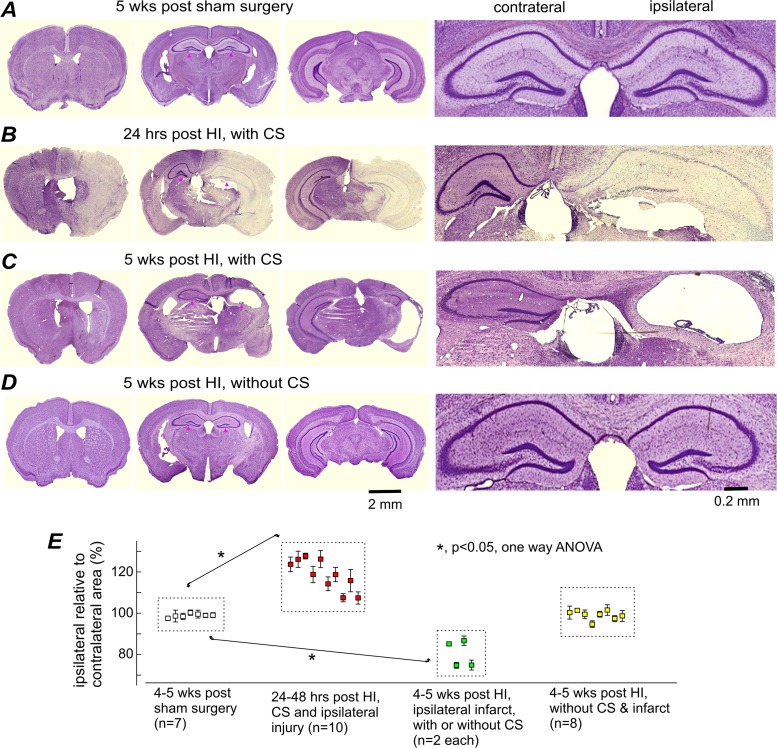
Fig 3. Ipsilateral brain injury or infarctions in aging mice with post-HI CS.
A-D, images of cresyl violet-stained brain sections were obtained from 4 aging mice. Left, low power views at three coronal levels. Right, magnified views of the dorsal hippocampal areas (denoted by black dots on low power view). Time of histologic preparation, experimental group, and CS occurrence were indicated for each animal above their respective low power images. E, ratios of ipsilateral relative to contralateral hemispheric areas were obtained at 8 coronal levels and averaged for each animal. Data (%, mean±SE) for individual animals were pooled together according to the indicated experimental groups. *, p<0.05, sham controls vs. other experimental groups, one way ANOVA.

