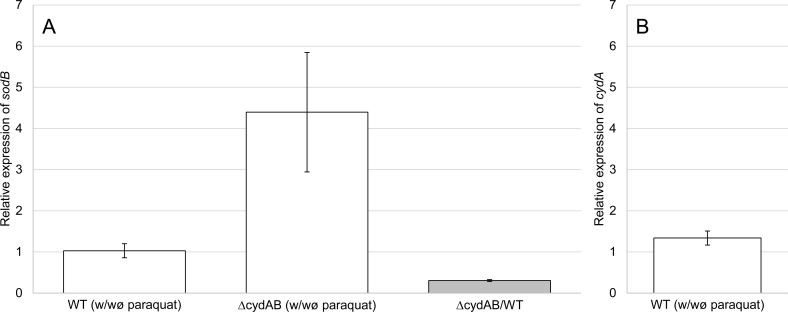
Fig 4. Relative expression of sodB.
The relative expression of sodB was quantified by qRT-PCR with the 2∆∆Ct method. The normalization was done with the glucokinase gene (PGN_0381). The white histograms represent, for wild-type or cydAB mutant strains, the relative expression of sodB (A) or cydA (B) between both conditions: with paraquat (320 μM) and without paraquat (control condition). The grey histogram represents the relative expression of sodB between cydAB mutant and wild-type (control condition) in absence of paraquat. Bars represent standard errors.

