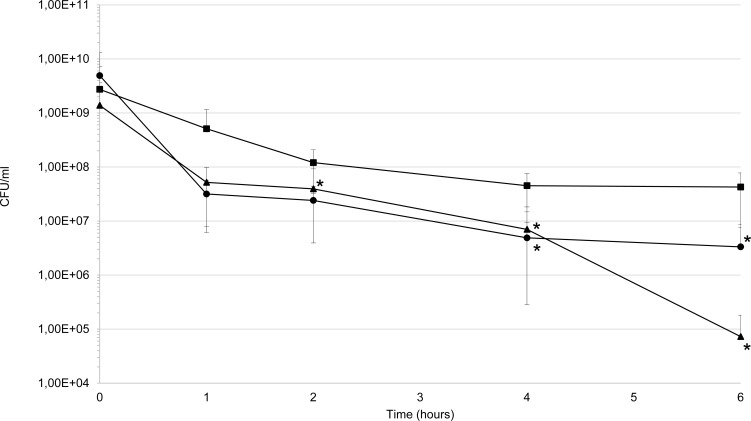
Fig 7. Dioxygen tolerance.
The resistance to dioxygen was assayed by counting colony-forming units of bacterial cells suspended in PBS with yeast extract (5 g/l) and maintained in an aerobic atmosphere for six hours. Wild type (■), cydAB mutant (▲) and complemented cydAB mutant (●). Bars represent standard errors and asterisks indicate statistically significant differences between values of wild-type strain and mutant or complemented mutant strains (* p<0.05). Statistical analysis were performed with GraphPad Prism software (California, USA). The Mann-Whitney test was used and p-values<0.05 were considered significant.

