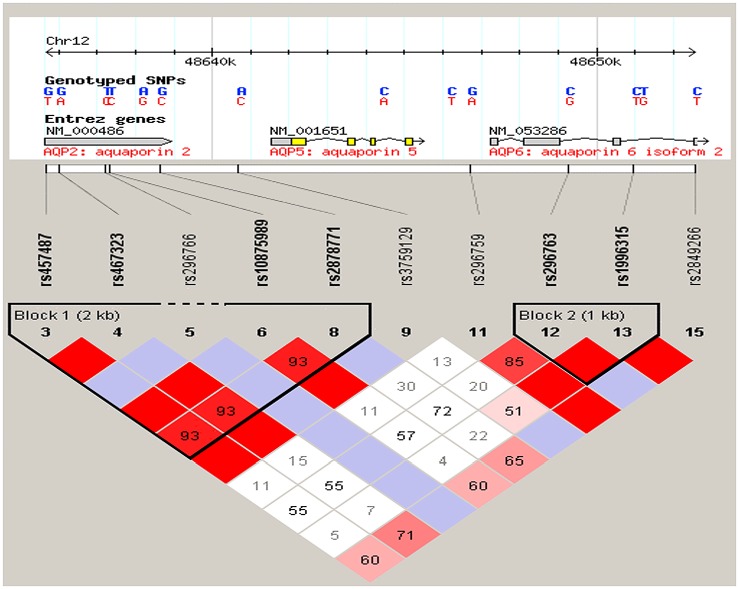
Fig 1. Linkage disequilibrium plot illustrating the aquaporin locus on 12q13 region investigated.
The single nucleotide polymorphisms are located in their approximate geographic positions in the chromosome and are distributed among the three genes. The relationship between two SNPs is represented by the intersection between the two squares and may present different colors (or color intensity) based on the value obtained for each pair. Red indicates D’ = 1 and LOD ≥ 2. Blue indicates D’ = 1 and LOD < 2. Shades of red/pink indicate D’< 1 and LOD ≥ 2. White indicates D’< 1 and LOD < 2. Markers selected for this studied include rs457487, rs467323, rs10875989, rs2878771, rs3759129, rs296759, rs296763, and rs1996315.

