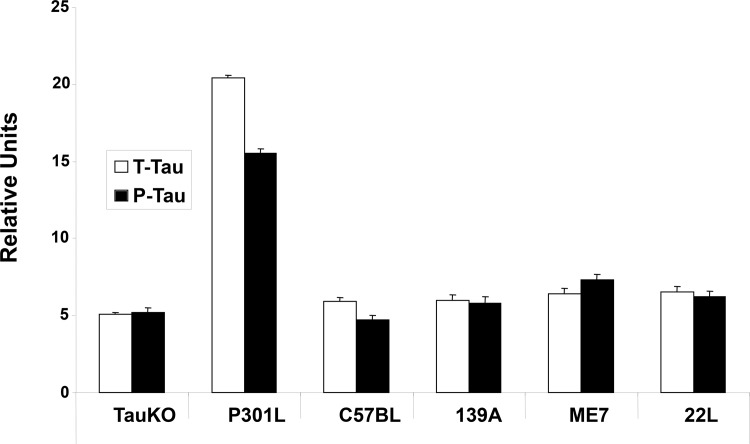
Fig 3. Analysis of T-Tau and P-Tau by a-EIMAF in plasma from ME7, 139A and 22L scrapie strain-infected mice.
Tau levels in plasma from P301L and C57Bl/6J are shown as controls. Data is plotted as mean ± SD. No significance differences, as determined by the unpaired t-test, was found between T-Tau and P-Tau values of C57Bl uninfected vs. ME7, 139A or 22L-infected C57Bl mice.

