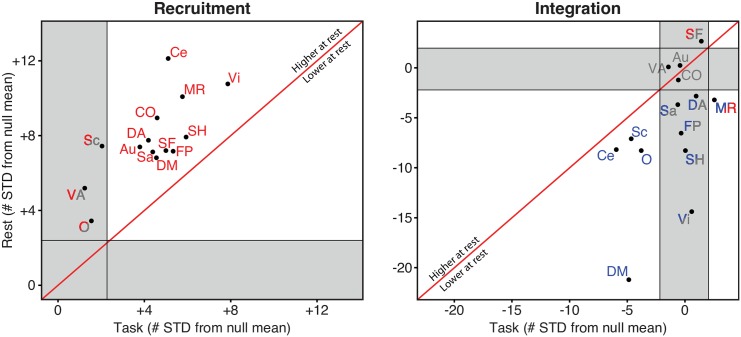
Fig 5. Cognitive Systems Are More Recruited and Less Integrated During Rest.
The recruitment and integration coefficients of each system were compared to its task and rest null models. Axes are expressed in terms of number of standard deviations away from the mean of the null distribution. The region above/below the diagonal line indicates that the coefficient is higher/lower at rest than during task. Systems whose coefficients are significantly above the null model are colored in red; systems whose coefficients are significantly below the null model are colored in blue; systems whose coefficients are indistinguishable from the null model are colored in gray. Systems that changed subregions between task and rest are represented in two colors, one for each condition.

