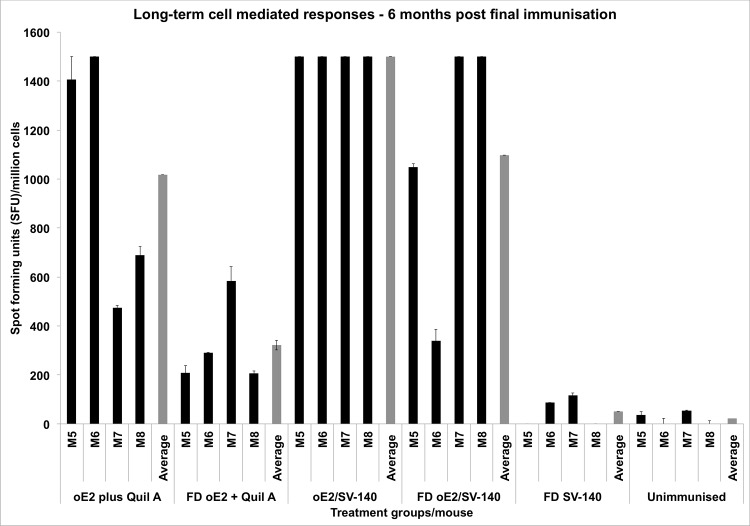
Fig 6. Detection of antigen specific IFN-γ secretion by ELISPOT assay of murine splenocytes from immunised mice.
The bars represent the number of cells producing IFN-γ in response to the oE2 antigen six months after the final immunisation. The grey bars show the average for each group and M5 to M8 represent the four individual mice in each group.

