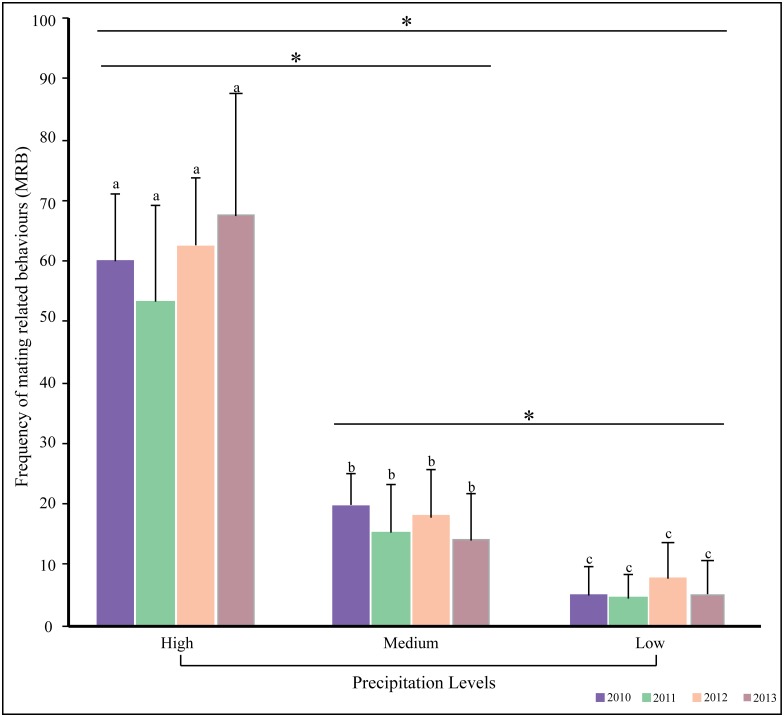
Fig 2. The frequency of MRB varied with precipitation levels.
The bar chart shows the mean and standard deviation of the frequency of all MRB occurring at different levels of precipitation (as noted during the time of observations), over four years, 2010 to 2013, during the primary mating season. Variation in the frequency of MRB was not significant across the four years within a precipitation category (alphabets), but varied significantly different levels of precipitation within a year (*).

