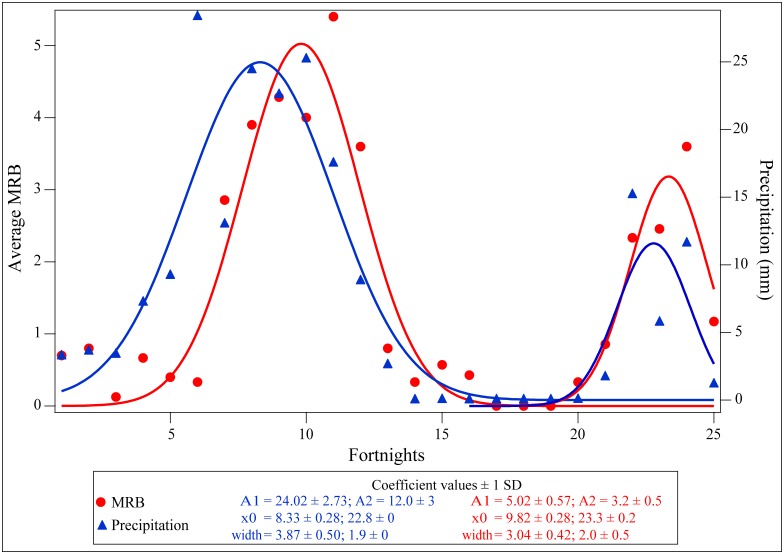
Fig 6. MRB and precipitation patterns show convergent double binomial trends.
The plot shows the relationship between the occurrence of mating related behaviours (MRB) and precipitation levels over a year, on a fortnightly basis. The red dots represent the number of MRB averaged over the number of locations sampled in a fortnight and blue dots represent the average precipitation level (from IMD) considering only the days of the census. Both the datasets fit double normal distributions, as represented by the lines of the respective colours. A1 and A2 represent the two amplitudes of the respective curves at x0 time as read from the x-axis.

