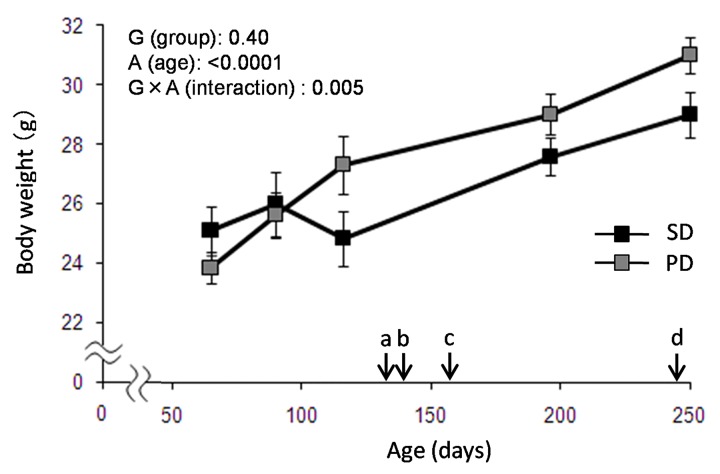
Fig 1. Body Weight Change in PD and SD fed mice.
Body weight was measured through the experiments in both SD and PD groups (N = 8 for SD, N = 9 for PD). Each arrow indicates (a) marble burying test, (b) headstage implant for sleep recording, (c) baseline and food deprivation, and (d) BrdU injections. Data are presented as mean ± SEM.

