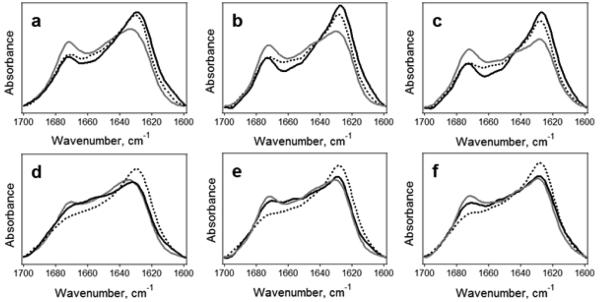
Figure 3.
FTIR spectra of unlabeled Aβ1-42 (black solid line), AβpE3-42 (dotted line), and their 1:1 combination (gray solid line) in D2O-based buffers of 50 mM NaCl, 50 mM Na,K-phosphate, pD 7.2 (a,b,c) and 10 mM Na,K-phosphate (pD 7.2) (d,e,f) for 10 min (a,d), 1 h (b,e), and 2 h (c,f). All spectra are normalized to a total area of 1.0.

