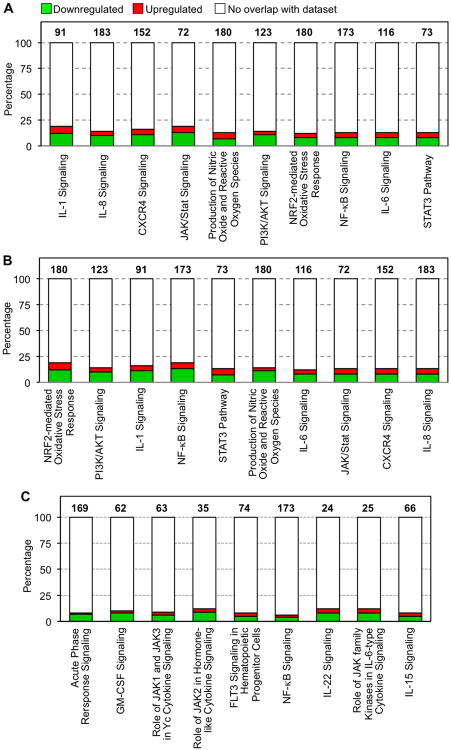
Figure 6. Differentially-expressed canonical pathways affected by EVLP.
(A) Ten canonical pathways focused on inflammatory and innate immune responses (selected from the significant canonical pathways in SDC Table 1, p<0.05) are shown along the x-axis that are significantly different between EVLP versus CSP. (B) Ten canonical pathways focused on inflammatory and innate immune responses (selected from the significant canonical pathways in SDC Table 2, p<0.05) are shown along the x-axis that are significantly different between EVLP+ATL223 versus CSP. (C) The canonical pathways resulting from the evaluation of genes uniquely differentially expressed in EVLP+ALT1223 vs. CSP (801 genes, FDR 1%). The total number of genes associated with each pathway is listed above each bar. Green and red bars indicate the percentage (y axis) of those genes down- or up-regulated, respectively, as calculated by (# genes in a given pathway that meet cutoff criteria)/(total # genes that comprise that pathway). Pathways are presented left-to-right from highest to lowest significance (specific p values are provided in SDC Tables 1 and 2).

