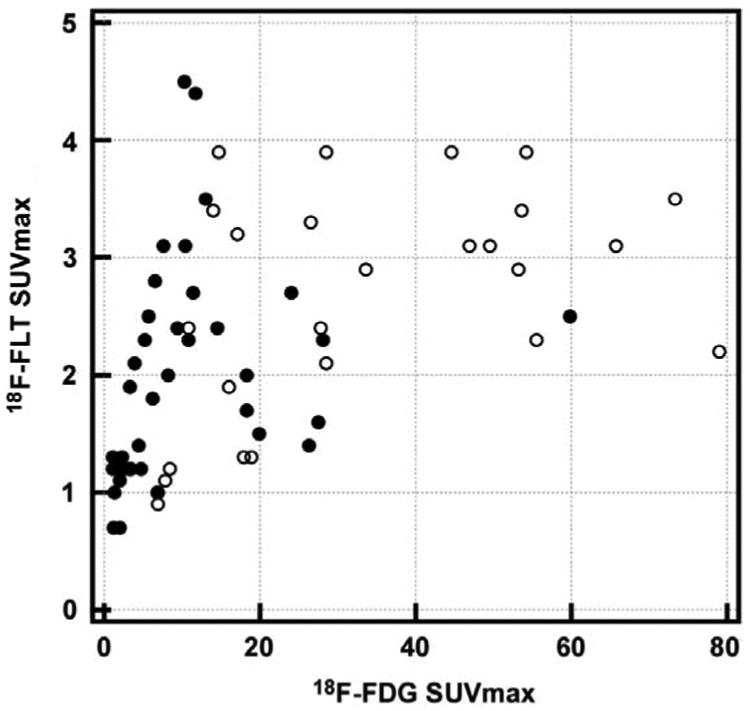
Figure 5. Scatter-plot displaying tumor 18F-FLT SUVmax values in relation to their 18F-FDG SUVmax.

Black rounds correspond to lesions from non-SDHB patients. White rounds correspond to lesions from non-SDHB patients. 18F-FLT SUVmax values in these lesions are low (average 2.25 [0.7-4.5]) whereas their corresponding 18F-FDG SUVmax values are high (average 10.8 [1.1-79.0]).
