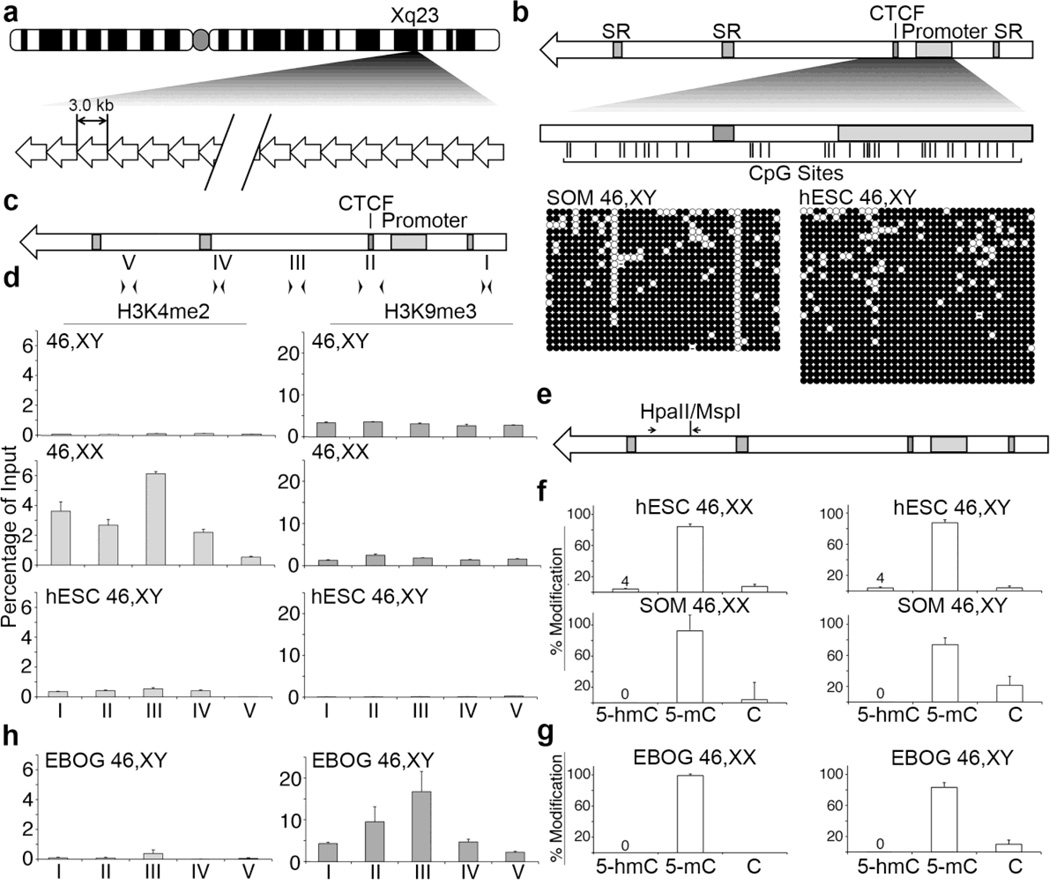
Fig. 1. Chromatin characterization in pluripotent and differentiated hESC.
(a) Ideogram of the human X chromosome indicating Xq23 and the location of DXZ4. A schematic representation of DXZ4 is shown beneath the ideogram, composed of 12–120 copies of the 3 kb repeat unit. (b) Schematic representation of a single DXZ4 monomer (top). Annotated features (shaded boxes) include simple repeats (SR), the CTCF binding site and the internal promoter. The region assessed by Bisulfite Sequencing (BiS) analysis is expanded immediately below, and vertical lines indicate the locations of all 36 CpG residues. The BiS profiles for male somatic fibroblasts (1139; SOM 46,XY), and male hESCs (H1; hESC 46,XY) are shown immediately below. The black (methylated) and white (unmethylated) circles indicate methylation status, while each horizontal row is the BiS profile from a single clone. A sequence that has diverged and is no longer a CpG is indicated by a dash. (c) Schematic DXZ4 monomer showing the location of primer sets used for qChIP: I (F6.R20), II (F23.R14), III (F17.R8), IV (F11.R22) and V (F4.R19). (d) qChIP data for H3K4me2 (left) and H3K9me3 (right) at DXZ4 for male (46,XY) and female (46,XX) somatic cells, and male hESCs (hESC 46,XY). Each data set is graphed as a percent of input. Error bars indicate standard deviation from the mean of triplicate qPCR reactions from two or more replicate ChIP experiments. (e) DXZ4 schematic indicating the location of the CpG that is part of a HpaII/MspI recognition site and the location of primers used for qRT-PCR. (f) Graphs showing the quantitation of percent 5-hmC, 5-mC, and C at the HpaII/MspI site. Female samples (46,XX) are shown on the left and include H9 (hESC) and IMR90 (SOM), whereas male samples (46,XY) are indicated on the right and include H1 (hESC) and 1140 (SOM). Data shown is from three independent biological replicates. (g) Quantitation of percent 5-hmC, 5-mC, and C at the HpaII/MspI site in female H9 (left) and male H1 (right) EBOG. (h) Graphs showing qChIP data as in part-(D) above, but for EBOG derived from male hESC (EBOG 46,XY).

