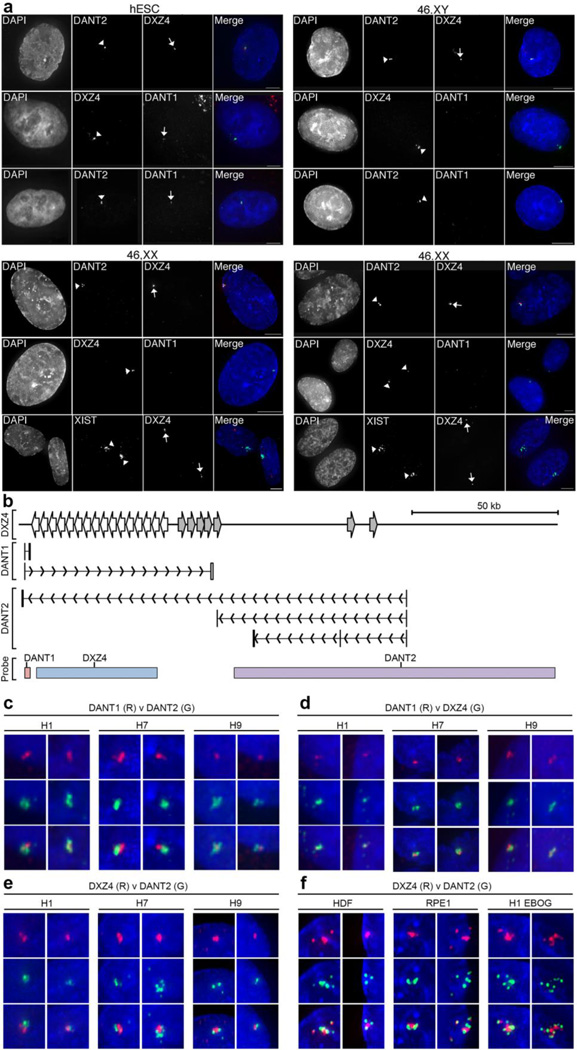
Fig. 5. RNA FISH Images showing allele-specific expression and spatial arrangement of DXZ4-associated lncRNAs.
(a) Detection of DANT1DANT2 and DXZ4 by direct-labeled RNA FISH probes in male H1 (hESC) and various male (1140: 46,XY) and female (46,XX: HDF-FET – left panel and RPE1 – right panel) somatic cells. For each sample column 1 shows nuclei counterstained with DAPI (white), column 2 shows labeled signals indicated by arrowheads. Column 3 shows signals highlighted by arrows. Column 4 consists of a merge of the DAPI-staining (blue) with direct-RNA FISH in columns 2 (green) and 3 (red). The white bars at the bottom right of the merged images indicate 5µm. In female somatic cell samples, the location of the Xi is defined by XIST RNA FISH. (b) Schematic map of the interval around DXZ4, indicating the location of short and ATT DANT1 and DANT2 transcriptional units. The location of probes used for RNA FISH is indicated at the bottom. The DANT1 probe is a cloned genomic fragment corresponding to DANT1-short exons 1–3, DXZ4 is BAC clone 2272M5 and DANT2 is BAC clone 761E20. Panels (c–f) show RNA hybridization signals for the direct-labeled FISH probes indicated (DANT1, DANT2 or DXZ4) labeled in red (R) or green (G) merged with DAPI staining of the nucleus (blue). Cell lines include male (H1) and female (H7 and H9) hESCs as well as H1 derived EBOG and female somatic fibroblasts (HDF) or epithelial (RPE1) cells. Overlapping signals appear yellow. Two representative examples are shown for each probe combination used on the various cell types. Each image is approximately 1µm across.

