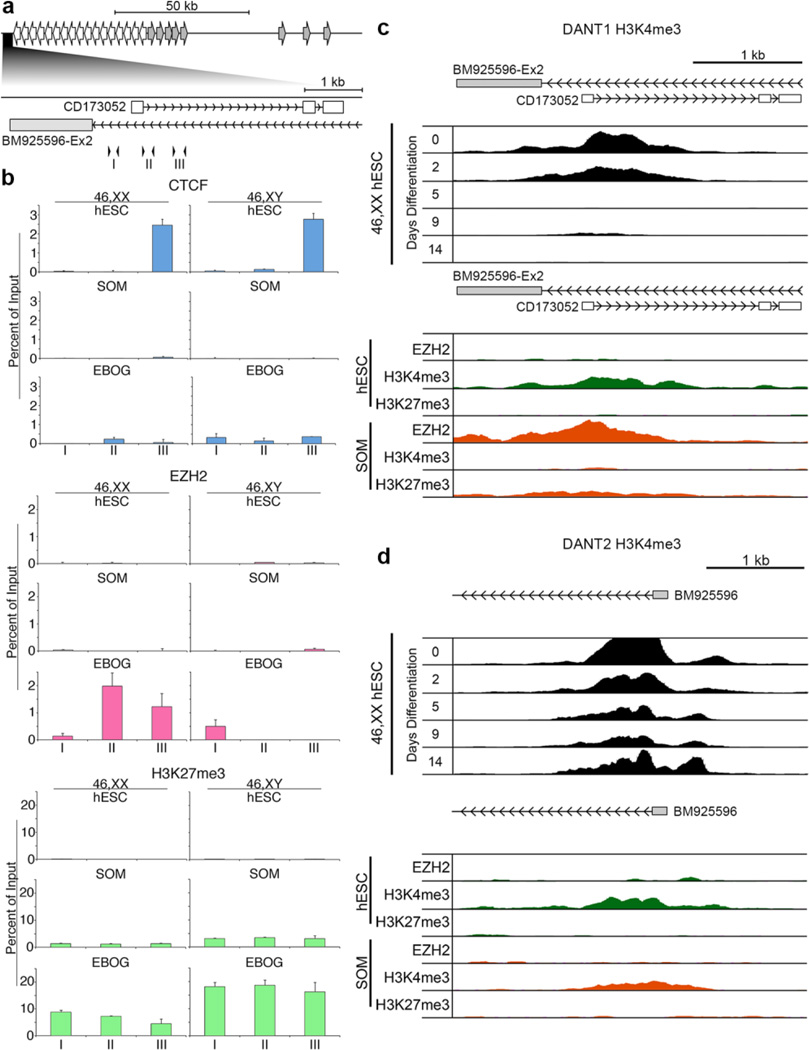
Fig. 6. Chromatin organization and dynamics around the DANT1 and DANT2 promoters.
(a) Schematic map of the DXZ4 interval indicating the relative location of the DANT1 promoter. Immediately below this, the DANT1 region is expanded, corresponding to 114,956,035–114,959,533 bp of chromosome X (hg19) and the location of the short DANT1 EST (CD173052) and DANT2 ATT exon (BM925596-Ex2) are indicated. Inverted arrowheads correspond to the location of qChIP primer sets I (F1.R1), II (F2.R2) and III (F3.R3). (b) qChIP data for CTCF, EZH2, and H3K27me3. Each is graphed as a percent of input and is the mean of triplicate qPCR reactions. Error bars indicate standard deviation. Female (46,XX) data sets are on the left with male (46,XY) on the right. For each ChIP target, the top row shows data for female (H9) and male (H1) hESCs, middle row for female (RPE1) and male (BJ1) somatic cells and bottom row for EBOGs derived from the corresponding hESCs. (c) A map showing the location of DANT1 short EST (CD173052) and DANT2 ATT (BM925596-Ex2) corresponding to 114,956,077–114,959,451 bp of the X chromosome (hg19) is shown at the top. Immediately beneath this is publicly available H3K4me3 ChIP-seq data for H7 hESCs (46,XX hESC) prior to (day-0) and at various days post-differentiation (days 2–14) (Consortium et al. 2012). Below this is publicly available ChIP-seq data from the same interval for EZH2, H3K4me3 and H3K27me3 in male H1 (hESC) and male HUVEC somatic (SOM) cells (Consortium et al. 2012). (d) As in part-(c) above, but for DANT2 and interval 115,083,137–115,086,987 of the X chromosome (hg19).

