
Figure 3.
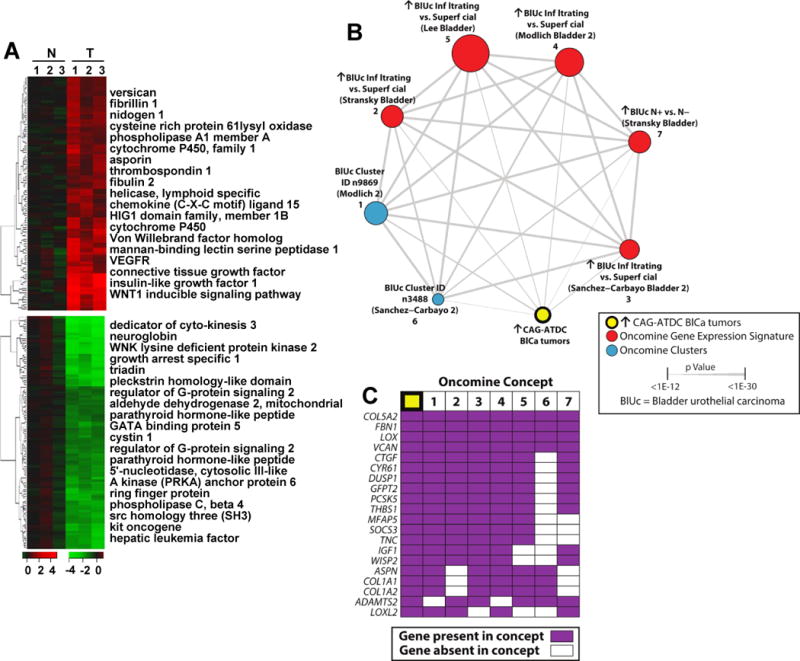
Gene expression analysis of CAG-ATDC bladder tumors reveals a similar profile to human invasive bladder tumors. (A) Heat map representation of up- (red) and down- (green) regulated genes in CAG-ATDC bladder tumors as compared to normal littermate control bladder tissue. Top genes from each category are listed to the right. (B) A molecular concepts map of the ↑ in CAG-ATDC BlCa tumors signature (ringed yellow node, n= 77 genes) and selected enriched molecular concepts demonstrated highly statistically significant overlap with human bladder cancer concepts. Each node represents a molecular concept, with node size proportional to the number of genes in the concept. The concept color indicates the concept type according to the legend. Each edge represents a significant enrichment (P < 1E–7), and the edge thickness is proportional to significance as indicated. Concepts and enrichments with the ↑ in CAG-ATDC BlCa tumors signature are given in Supplemental Table 5. (C) The top 20 most represented genes across the indicated enriched concepts are shown, with genes present in each concept indicated by purple box. Concepts are numbered as in (B).