
Figure 6.
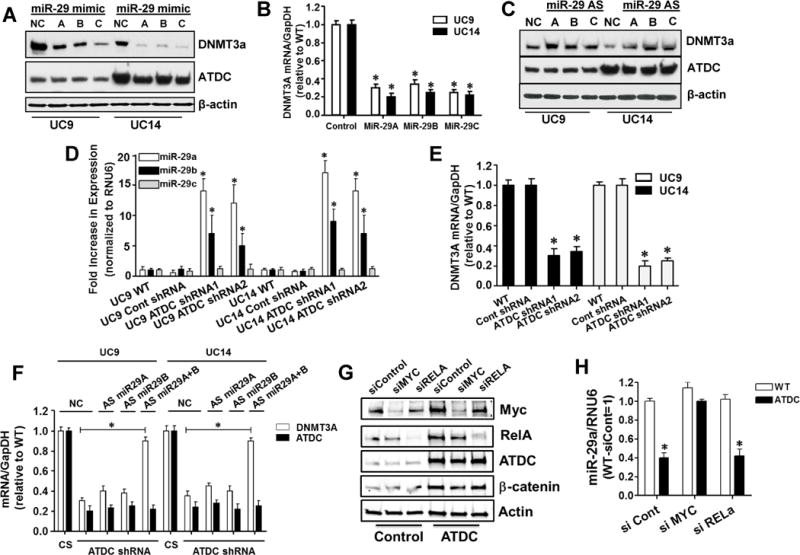
ATDC suppresses miR-29 expression resulting in increased expression of DNMT3A. (A and B) Transfection of miR-29A, B and C into UC9 and UC14 bladder cancer cells lines suppresses DNMT3A protein and mRNA expression (mean±SE, n=3, * p < 0.05 vs WT). (C) Transfection of miR-29A, B and C antisense (AS) oligonucleotides into UC9 and UC14 cells results in increased DNMT3A protein expression. (D) Stable expression of ATDC-targeting shRNAs in UC9 and UC14 but not control shRNA, resulted in increased miR-29A and B, but not miR-29C levels as measured by TaqMan qRT-PCR (mean±SE, n=3, * p < 0.05 vs WT). (E) Knockdown of ATDC results in lower levels of DNMT3A mRNA as measured by RT-PCR (mean±SE, n=3, * p < 0.05 vs WT). (F) Transfection of both miR-29A and B antisense oligonucleotides allows recovery of DNMT3A expression in ATDC knockdown cell lines, NC = negative control miRNA, CS = control shRNA, AS = antisense miRNA (mean±SE, n=3, * p < 0.05 vs CS) . (G) ATDC overexpression in SV-HUC1 cells induces increased MYC and β-catenin expression and transfection of siRNA targeting MYC and RELA knocked down protein expression. (H) Overexpression of ATDC suppressed miR-29A in SV-HUC1 cells and knockdown of MYC, but not RELA eliminated ATDC suppression of miR-29A (mean±SE, n=3, * p < 0.05 vs siCont).