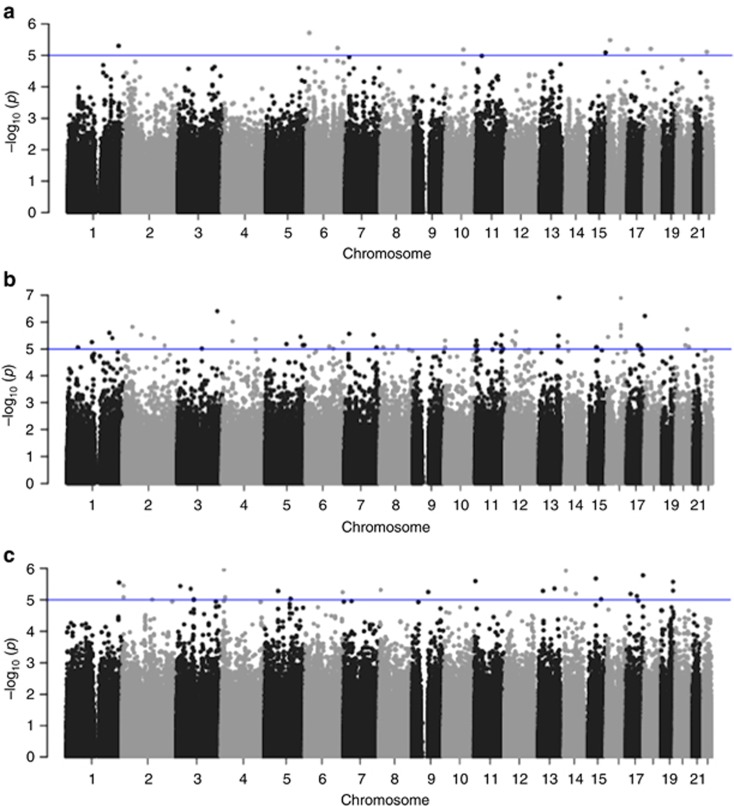
Figure 2.
Results of the GWAS of zileuton response. Manhattan plots show GWAS results for the discovery cohort (Abbott trial 1) for additive (a) dominant (b) and recessive (c) genetic models. For each plot, the y axis represents –log10(P-values) for each SNP (gray and black dots), grouped by chromosomes 1–22 (x axis). Horizontal lines in the plots indicate the threshold for suggestive genome-wide significance (P=1 × 10−05).

