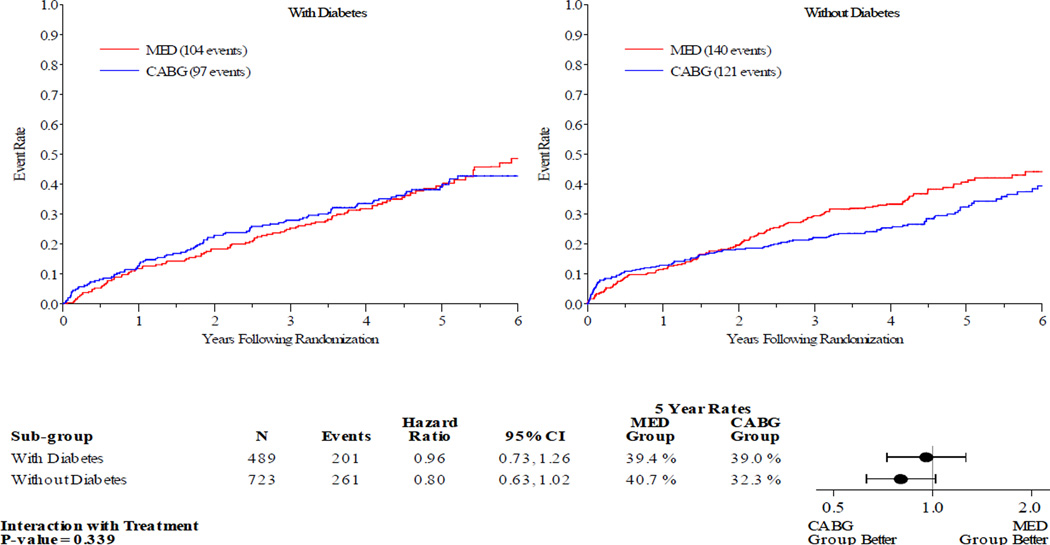
Figure 2.
Kaplan-Meier Estimates of All-Cause Mortality or Cardiovascular Hospitalization Rates for CABG vs. MED as Randomized (ITT). Red lines represent event rates in patients treated with MED alone. Blue lines represent event rates in patients treated with MED and coronary CABG. CABG – coronary artery bypass grafting; ITT – intention to treat; MED – optimal medical therapy.

