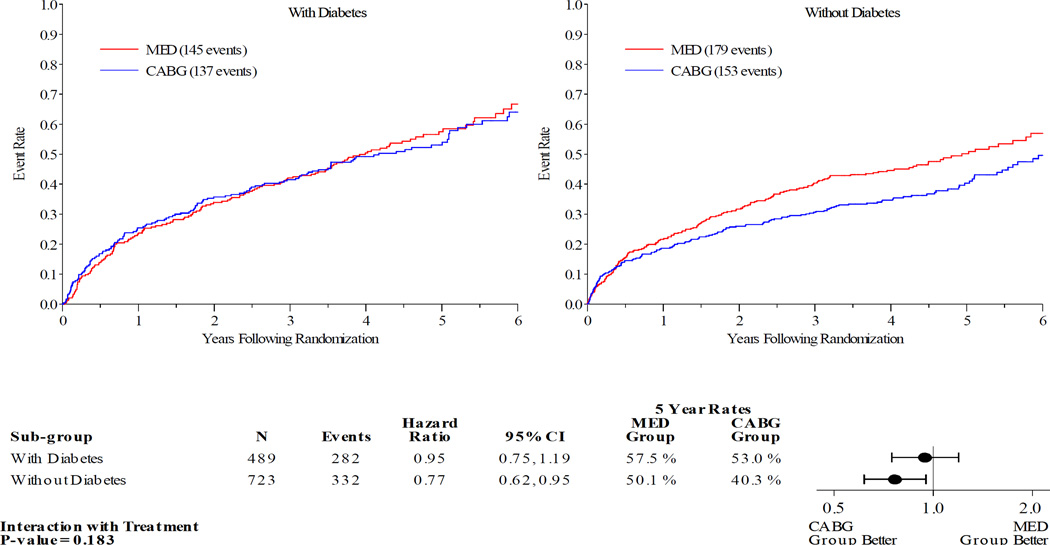
Figure 4.
Kaplan-Meier Estimates of All-Cause Mortality or Heart Failure Hospitalization Rates for CABG vs. MED as Randomized (ITT) . Red lines represent event rates in patients treated with MED alone. Blue lines represent event rates in patients treated with MED and coronary CABG. CABG – coronary artery bypass grafting; ITT – intention to treat; MED – optimal medical therapy.

