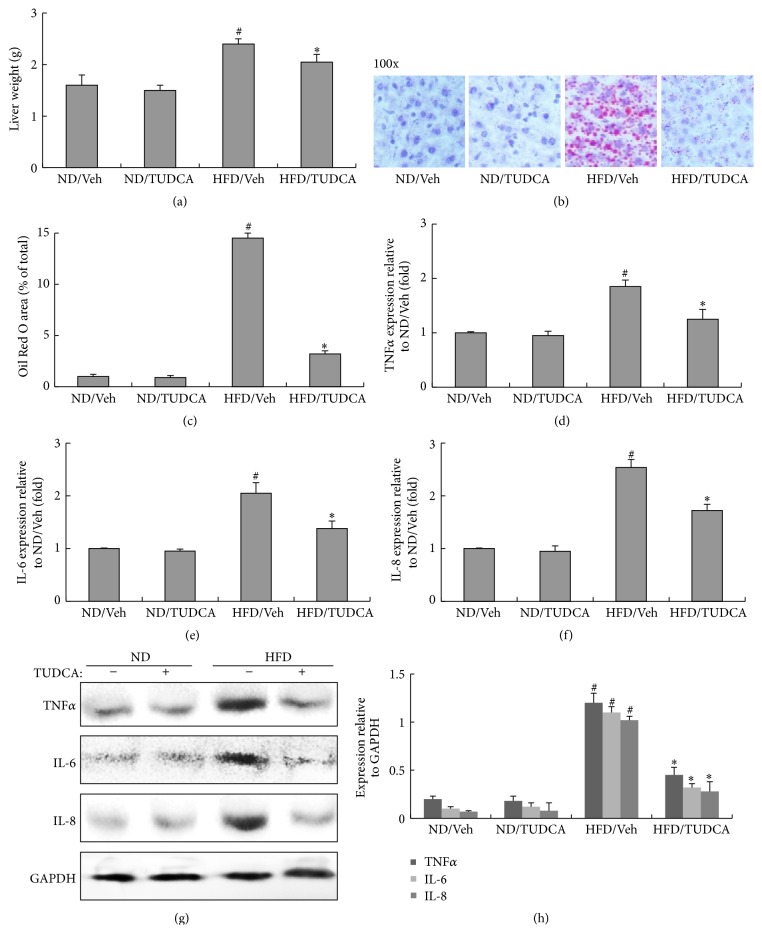
Figure 2.
Effects of TUDCA on liver steatosis in obese mice. All analyses were performed in mice fed a normal diet (ND) or a high-fat diet (HFD) for 8 weeks and then injected daily with 500 mg/kg of TUDCA or with vehicle (Veh) for 8 weeks. (a) Liver weight. (b) Oil Red O staining of liver sections (magnification 100x). (c) Histomorphometric quantification of the Oil Red O positive area in liver. (d) Relative expression of TNFα in liver (real-time PCR). (e) Relative expression of IL-6 in liver (real-time PCR). (f) Relative expression of IL-8 in liver (real-time PCR). (g) Protein expression of TNFα, IL-6, and IL-8 in liver. (h) The relative protein quantity of TNFα, IL-6, and IL-8 in liver. The relative quantity of proteins was analyzed using Quantity One software. A representative blot is shown and the data was expressed as mean ± SEM in each bar graph. ∗ P < 0.05 (HFD/TUDCA versus HFD/Veh). # P < 0.05 (HFD/Veh versus ND/Veh).

