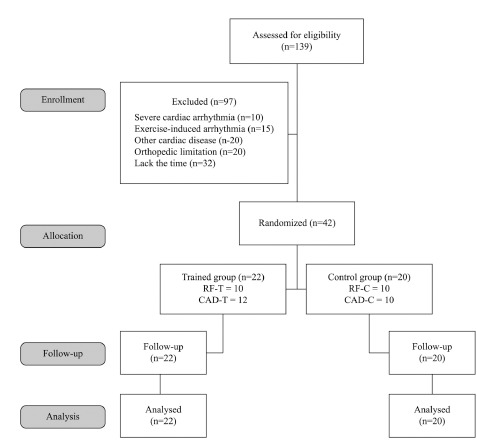
Figure 1. Flowchart showing patient participation in the study. CAD-T= trained group with patients with coronary artery disease; CAD-C= control group with patients with coronary artery disease; RF-T= trained group with patients with cardiovascular risk factors; RF-C= control group with patients with cardiovascular risk factors.

