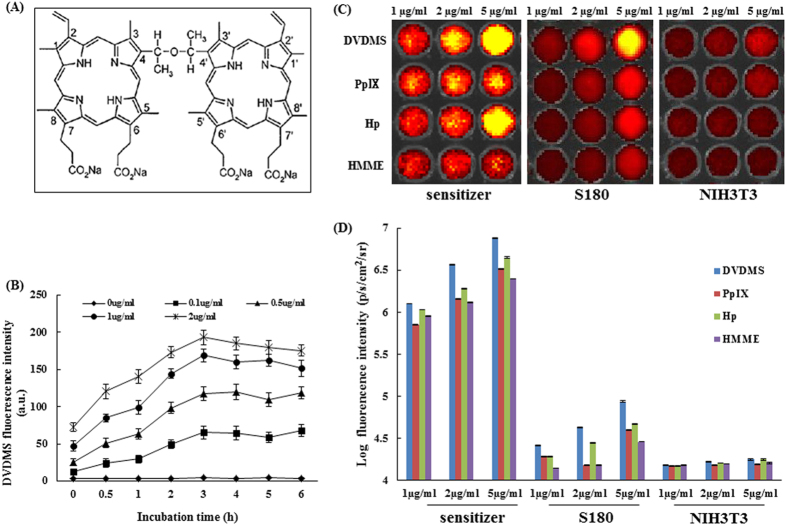
Figure 1. Fluorescence intensity of different sensitizers in normal cells and cancerous cells under the same experimental conditions.
(A) Chemical structure of DVDMS. (B) Cellular uptake of DVDMS. (C) Fluorescence photographs of the four sensitizers, sensitizers in NIH3T3 cells and S180 cells in NIH3T3 cells and S180 cells under the same experimental conditions. (D) Fluorescence intensity of (C). The fluorescence intensity was recorded as photons per second per centimeter squared per steradian (p/s/cm2/sr). Data are presented as the mean ± standard deviation of three independent experiments.

